Featured Webinar: Better Together: How Voxco’s Survey Technology Complements Ascribe - February 6 at 11am EST
Take a peek at our powerful survey features to design surveys that scale discoveries.
Explore Voxco
Need to map Voxco’s features & offerings? We can help!
Get exclusive insights into research trends and best practices from top experts! Access Voxco’s ‘State of Research Report 2024 edition’.
We’ve been avid users of the Voxco platform now for over 20 years. It gives us the flexibility to routinely enhance our survey toolkit and provides our clients with a more robust dataset and story to tell their clients.
Steve Male
VP Innovation & Strategic Partnerships, The Logit Group
Explore Regional Offices
Find the best survey software for you!
(Along with a checklist to compare platforms)
Take a peek at our powerful survey features to design surveys that scale discoveries.
Explore Voxco
Need to map Voxco’s features & offerings? We can help!
Find the best customer experience platform
Uncover customer pain points, analyze feedback and run successful CX programs with the best CX platform for your team.
We’ve been avid users of the Voxco platform now for over 20 years. It gives us the flexibility to routinely enhance our survey toolkit and provides our clients with a more robust dataset and story to tell their clients.
Steve Male
VP Innovation & Strategic Partnerships, The Logit Group
Explore Regional Offices
SHARE THE ARTICLE ON
Contact Center Dashboard is an online reporting tool that uses data to help improve the call centers’ productivity, performance, and intelligence.
For consumer-centric businesses, call centers play a vital role in providing flawless customer service. And, to continue capturing prospective customers/clients, Call Centers need to leverage the data available to them.
01
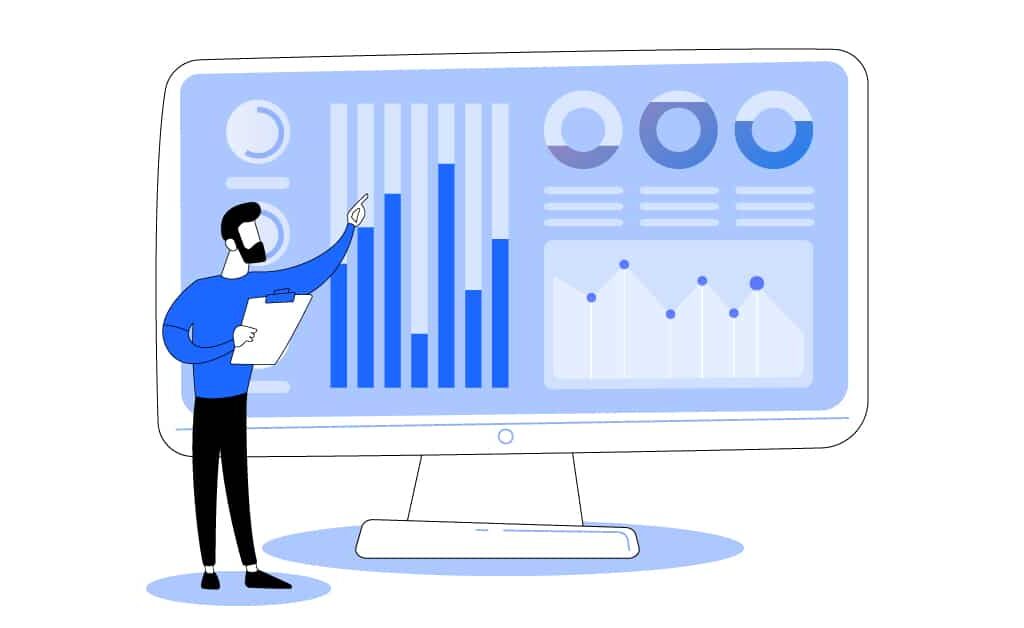
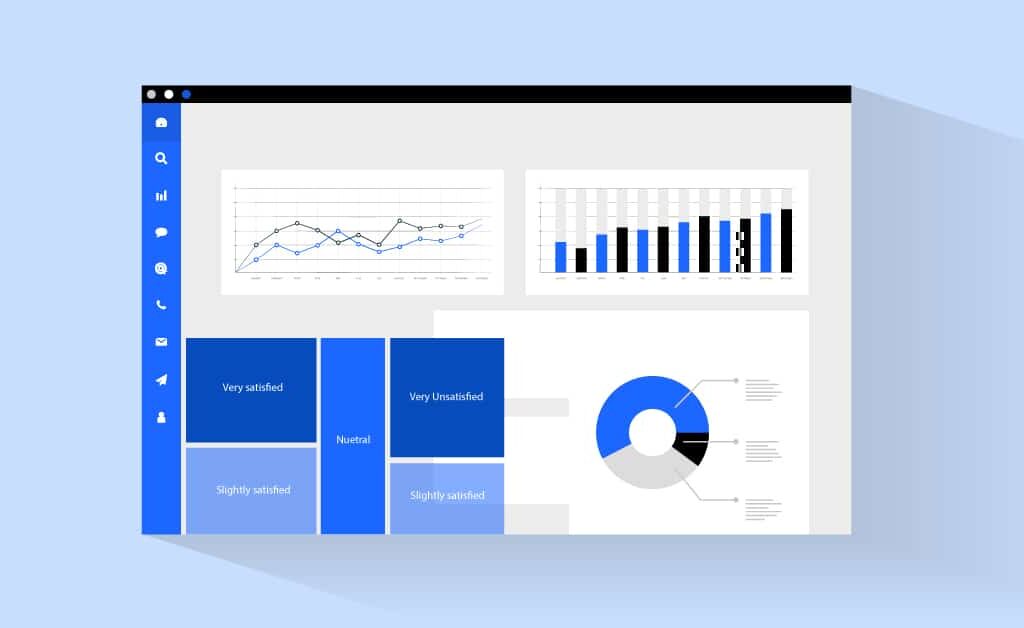
A Call Center Dashboard is a visual reporting tool. The tool displays relevant KPIs and calls center metrics. These metrics and data allow the call center management to study and analyze the performance of the agents. Moreover, these data can help the managers and supervisors optimize the performance to achieve the company goal.
The visual reporting tool is interactive in design, making it easy for the call center employees to draw out real-time data.
In general, a Contact Center Dashboard has two categories. These categories are Agent Performance and Call Center Performance. Let’s see what data a dashboard can provide for you.
Survey organizations around the world have maximized their phone survey ROI with the advanced features, hosting options, seamless telephony integration, and flexible pricing of our CATI software.
02
Call statistics represent in the Dashboard the relevant call log metric. These metrics are
The call logs indicate how the volume of calls your call center deals with every day. While seemingly insignificant, it is crucial to keep track of the call logs to guarantee flawless functioning.
A performance indicator gives you a detailed report of calls handled by different phone lines that belong to your call center. You can use the phone numbers and study the days and hours of the higher volume of calls.
For example, the indicator displays what hour of the days you have received the most missed calls along with the reason for missed calls.
Moreover, it also shows you how an agent had more activity based on the time defined as a parameter on the report. This can help you plan how to extend work hours.
Agent performance and call management are essential when it comes to the overall Call Center Performance. Agent performance features of Contact Center Dashboard can display how each department/team is managing their calls. It can give you a report of call count, average waiting time, average talk time, etc., against each team.
You can also delve further at the agent level. This way, you can identify which agent requires training and which agent is a high performer.
Average wait time accounts for the time an inbound call waits in the queue before they are connected to any agent. This means it calculates the amount of time a customer is kept on hold before talking with an agent.
With the increasing demands of the customers, the Contact Center has to keep up. The traditional industry standard aims for 80% of calls answered within the first 20 seconds.
The AWT trends give you a report on how well your contact center is keeping with its own service level goal.
Average talk time indicates the amount of time an agent engages in a conversation with a customer. This metric is of high importance in call centers because it exhibits the customer’s interaction and exposure to the company’s representative.
Too long a call is a clear suggestion of a slow or complicated wrap-up system. With the help of the ATT trend, you can analyze and gauge the overall call center performance across different times.
All this data can help you create well-informed and data-driven decisions to enhance the performance and productivity of your Call Center.
See what question types are possible with a sample survey!
03
Call Center Dashboard plays a vital role in carrying the success of your business. It aids the management in keeping track of the service level and improves it further for a favorable outcome.
How exactly a Contact Center Dashboard benefits your business and improves the quality of service level is explained as follows.
Learn how to meet respondents where they are, drive survey completion while offering a seamless experience, Every Time!
04
Set your customer service goal to determine which key metrics you will use to measure the performance of your call center. After you set your goal and determine the metrics, you can optimize your Contact Center Dashboard to track them.
Figure out which performance metrics you want to improve and how to improve those metrics. This will help you see a clear picture of how you need to plan your operational process.
As you set your goal, you should choose the performance metric to align and benefit your goal. Choosing the right metric and focusing on improving those metrics will keep the process steady.
The process and requirements will be clear to all the agents and managers. This straightway of organizing things will lead directly to the success of your customer service.
List of metrics you can use as reference are:
The contact center agents are the representative of the company to the customers. They have to interact with the customer every hour and day.
It is essential that your agents are well trained, motivated, and happy so that your contact center does not suffer. Training your agents and analyzing their performance at regular intervals can motivate the agents to perform better.
You can use the Dashboard to monitor the performance of each agent and share it with the agents. This way, you can involve the agents from coming up with a plan to improve their performance.
Contact Centers gives their customer multiple mediums to stay in touch with the center. Use your Dashboard to track the performance in each of these mediums. You can identify which medium has what issues and arrange a proper solution for it.
05
Voxco has many tools to help you manage and improve the service quality of your contact center
The Voxco Dialer dashboard provides a live window on individual agent productivity. You can compare how much time agents spend on talking, pause, wrap-up, the number of calls handled, and more.
Get a live view of how individual projects are going. You can monitor talk time per hour, the average delay between calls, drop rate, call distribution, and more.
Optimize productivity in your contact center and manage your drop rate for individual projects.
Switch to Voxco Telephony System to improve your Call Center Productivity by 400% or more
Survey organizations around the world have maximized their phone survey ROI with the advanced features, hosting options, seamless telephony integration, and flexible pricing of our CATI software.
06
A Contact Center Dashboard is a digital reporting tool. It displays metrics and KPIs to help managers and executives monitor the overall performance of the call center and the performance per-agent basis.
The Dashboard allows the call center management to understand the metrics and analytics that influence their business. A contact center dashboard compiles data and creates visual trends for the management to analyze and optimize the performance of the contact center.
Dashboard and Report both serve the same purpose, but their arrangement is different.
A Dashboard is primarily used to monitor the ongoing process of the entire call center and the individual employee. A report brings a collection of tables, charts, and graphs for detailed analysis, at a regular interval.