
T-test
Introduction to T-tests Use T-tests for statistical survey analysis Get started with Voxco Table of Contents 01 What is a T-test? The T-test is an

Find the best survey software for you!
(Along with a checklist to compare platforms)
Take a peek at our powerful survey features to design surveys that scale discoveries.
Explore Voxco
Need to map Voxco’s features & offerings? We can help!
Find the best customer experience platform
Uncover customer pain points, analyze feedback and run successful CX programs with the best CX platform for your team.

We’ve been avid users of the Voxco platform now for over 20 years. It gives us the flexibility to routinely enhance our survey toolkit and provides our clients with a more robust dataset and story to tell their clients.
Steve Male
VP Innovation & Strategic Partnerships, The Logit Group
Explore Regional Offices

Find the best survey software for you!
(Along with a checklist to compare platforms)
Take a peek at our powerful survey features to design surveys that scale discoveries.
Explore Voxco
Need to map Voxco’s features & offerings? We can help!
Find the best customer experience platform
Uncover customer pain points, analyze feedback and run successful CX programs with the best CX platform for your team.

We’ve been avid users of the Voxco platform now for over 20 years. It gives us the flexibility to routinely enhance our survey toolkit and provides our clients with a more robust dataset and story to tell their clients.
Steve Male
VP Innovation & Strategic Partnerships, The Logit Group
Explore Regional Offices

Find the best survey software for you!
(Along with a checklist to compare platforms)
Take a peek at our powerful survey features to design surveys that scale discoveries.
Explore Voxco
Need to map Voxco’s features & offerings? We can help!
Find the best customer experience platform
Uncover customer pain points, analyze feedback and run successful CX programs with the best CX platform for your team.

We’ve been avid users of the Voxco platform now for over 20 years. It gives us the flexibility to routinely enhance our survey toolkit and provides our clients with a more robust dataset and story to tell their clients.
Steve Male
VP Innovation & Strategic Partnerships, The Logit Group
Explore Regional Offices

See what question types are possible with a sample survey!
SHARE THE ARTICLE ON
The Abandon rate is one of the most popular KPIs (key performance indicators) for any call center. One of the call center’s main objectives is to reinforce the bonds you’re building with not only your current call center customers but also possible new ones and abandon rate plays a pivotal role in determining customer engagement.
Get a free demo with our call center experts. See what Voxco can do for you!

The abandon rate refers to the percentage of tasks that a customer abandons before completing the intended task. The abandon rate is a widely used metric in two industries in particular. Call centers are the largest, and e-commerce is the second. Call abandonment rates can be used to assess the success of call center customer experience.
In general, a call center abandonment rate of between 5% and 8% is considered the industry norm. When the rate reaches 10%, you’ve entered “big” territory.
Call center abandonment is a critical KPI that must be closely monitored at all times. When attempting to measure it accurately, there are a number of drawbacks to be aware of. Numbers alone don’t always say the whole tale. To fully understand what is going on in your center, you need to understand the meaning behind the figures.
There are a few important points to bear in mind if you want to prevent many of the common issues associated with calculating call center abandonment rates and provide reliable call center analytics.
The abandonment rate is a crucial metric because it gives the company insight into consumer preferences and can predict customer satisfaction levels. The abandon rate for an inbound call center is the percentage of inbound phone calls made to a call center or service desk that the customer abandons before communicating with an employee. It’s measured as the number of abandoned calls divided by the total number of inbound calls.
The rate of abandonment is proportional to the length of time spent waiting. The longer consumers wait before speaking with an agent, the higher the abandon rate will be, as people get frustrated waiting for help and hang up before speaking with an agent.
IMPORTANT NOTE: The number of abandoned incidents divided by the total number of incidents is the general formula for calculating the abandoned rate.
Using the following equation to figure out your call center’s abandon rate:
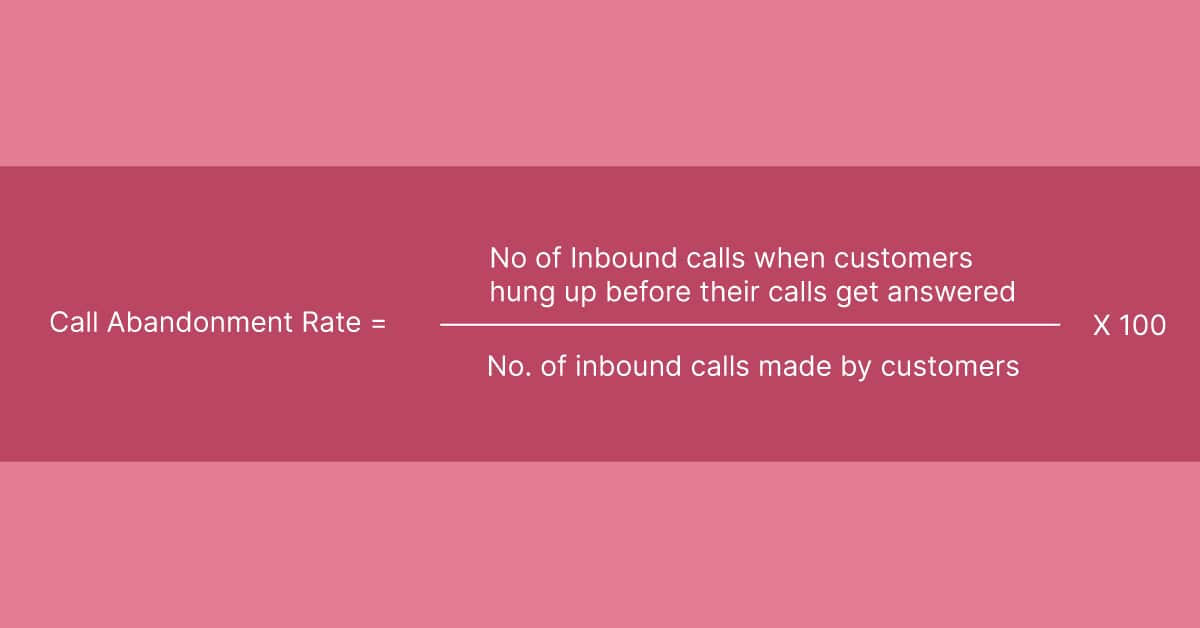
So, if you got 100 calls in your call center queues in a single day, 25 of them were abandoned in less than five seconds, but 70 of them were successfully treated, the equation would be:
The call center abandonment rate in the example above will be 6.66 percent.
It’s worth noting that the remaining five calls that were not either abandoned or successfully treated may have been caused by simple disconnections, an inability to contact a live agent or a variety of other issues.
The call abandonment metric is unique that it can be used in both a strategic and tactical capacity. From a strategic point of view, you can monitor this metric over time to spot patterns in your call centre that you can address with staffing or technological solutions. A situational or real-time view of this measure, on the other hand, is critical for recognising issues when they arise and preventing a few dropped calls from becoming a larger problem.
Get a free demo with our call center experts. See what Voxco can do for you!
Calls to call centers are dropped for a variety of reasons, including but not limited to:
Learn how to meet respondents where they are, drive survey completion while offering a seamless experience, Every Time!
Call center and customer service analytics monitor the result of each contact rather than simply counting the number of calls received by the company. When a customer calls your call center, success is measured not by how quickly they answer the phone, but by how well they resolve the problems they’ve experienced.
Long queue times, unsatisfactory answers, complicated entry procedures, and other issues can all be highlighted by an abnormally high number of abandoned calls in your call center. The percentage of abandoned calls will also guide you to the places where calls are dropped the most often, giving you a faster way to address customer issues.
Abandon rates are considered to be between 5% and 8%. However, depending on the time of day and industry, rates can exceed 20%.
Your Abandon Rate is 2.5 percent if your inbound call centre receives 1,000 calls a day and 25 are abandoned.
The abandon rate is influenced by a number of other KPIs, and changing response to these KPIs will lower the abandon rate. A 10% abandon rate is considered strong, and traditional wisdom suggests that a 5 to 8% abandon rate is the industry standard. However, recent studies have shown that call abandonment rates on mobile phones may be as high as 20%.
Let’s take a look at the KPI that contributes to a high abandonment rate.
When the customer has completed the IVR Survey and is in line to be linked with an agent, the average speed to respond comes to an end. The minimum average time for a customer to communicate should be 30 seconds, depending on the sector and the severity of the problem, but some support companies admit to taking twice as long.
The service level KPI is fed by the average speed to answer KPI. This is a KPI that tracks how many calls are answered in a given amount of time. For example, how many calls are answered in less than 30 seconds on average?
The estimation of a certain number of inbound calls in a given timeframe is known as call forecasting. Forecast variance is a metric for how far a forecast deviates from reality. Developing a baseline from which to forecast and fine-tuning the accuracy takes time.
When a seat is vacant, no agent is available to take a call. When it comes to hiring to satisfy demand, agents must stick to their work schedules.
The occupancy rate is a measure of how many agents are on duty at any given time, as well as call completion rate and after-call activity.
Depending on how well an agent’s software integrates with their CRM and productivity applications, after-call work can consume a significant amount of an agent’s time. Reducing after-call work with an intuitive interface allows agents to get back on the phone faster without losing the quality of the information in their customer files.
The length of the call is determined by the severity of the inbound problem with the customer. By creating a call center-specific baseline, you can reduce call duration without sacrificing first-call resolution or customer satisfaction. This means more agents are available to handle calls, but more importantly, it means the customer’s issue was resolved quickly.
It’s easy to measure customer satisfaction. To set a low bar, a happy customer is one who does not complain. It needs advanced call center software that looks at a customer’s past, call frequency, and other problems that are observable with high-quality call center software to set the bar very high.
Handling problems on the first call increases customer loyalty and customer satisfaction. Whether it’s a business deal or a problem that needs to be resolved. Different sectors should have different first-call resolution baselines. After all, directing a complicated financial transaction or troubleshooting a technological challenge is simpler than making a purchase or scheduling an appointment.
At the same time, call centers are people- and data-driven. Managers and supervisors are left throwing plans at the wall to see what sticks without using tools that can calculate these KPIs. Through establishing baselines for these KPIs, call center management may determine which areas need improvement in order to achieve an optimal call center abandon rate, improve customer loyalty, and even minimize agent absenteeism and disengagement, which leads to experienced agent attrition.
High abandonment times in call centers can signify a company’s under-allocation of resources to the call center or help desk, which may harm a company’s reputation for poor customer service. As someone who has spent a considerable amount of time waiting in a virtual queue for customer service will attest, it can also result in missed revenue opportunities and highly disappointed customers.
It could mean that an online retailer’s rates are higher than those of its competitors. It’s likely that a customer did some price comparison research before checking out and ended up purchasing their items from another online retailer. Online retailers also use the data generated by abandoned carts to improve their marketing strategies, and they can end up selling promotional goods to the cart’s owner in an effort to complete the sale.
See what question types are possible with a sample survey!
To reduce call abandonment, call centers must improve their response time, deal with scheduling issues, take post-call notes, monitor call length, and improve first-call resolution. Your call center program should have access to all of these metrics.
The time between when someone expresses an interest in speaking with a live agent (by picking up the phone and dialing your number) and when they have someone on the line should be 30 seconds or less. However, studies have shown that some businesses take an average of a minute or more to react. Predictive behavioral routing, among other approaches, could be useful in combating this.
If a call center isn’t adequately staffed to meet demand, it’s all too easy for people to be forced to wait on hold for longer than they should. This is normally due to a failure to predict demand within a specific timeframe.
This applies to all of the other responsibilities that an agent has in addition to answering calls. Anything they do “after the call” diverts their attention away from the phone lines, which can result in scheduling conflicts and resolution delays.
It’s no secret that some problems are more difficult to resolve than others. However, failing to properly prepare for the number of complicated issues you receive will cause agents to spend longer periods of time on the phone, delaying the time it takes to address their issue and decreasing their overall satisfaction. If agents are on the phone for an extended period of time, this may result in longer wait times for new callers, as well as more abandoned calls.
It’s also worth noting that call abandonment rates are higher when a caller doesn’t get the resolution they want on the first call. To put it another way, if someone is calling about the same issue or question for the second, third, or even fourth time, they are much more likely to get irritated and hang up the phone. This may be due, among other things, to a lack of call center agent skills.
It’s also worth noting that just because you have a “low” call abandonment rate overall doesn’t mean you’re in the clear when it comes to customer satisfaction, which is maybe the most critical metric of all. As previously said, even though all five calls were legally “resolved” as soon as possible, someone isn’t going to be pleased if they have to call five times about the same thing. In this regard, far too many consumers make the mistake of setting the bar too low. You must be able to go beyond “customers are happy as long as they are not complaining.” That isn’t always the case, however.
Similarly, there are positive explanations for why calls could be dropped. Customers will find answers when waiting on hold if your company has set up a self-service or self-help portal, such as a Knowledge Base. They may have requested assistance via a variety of platforms, including web forums or chatbot vs live agent, and arrived at the same conclusion while on hold. In that scenario, the abandonment rate would still be high, but it wouldn’t necessarily suggest that anyone was dissatisfied with the interaction. However, far too many call centers lack the tools required to comprehend the situation’s context in this degree of detail.
Finally, keep in mind that none of these problems are most likely to blame for the high abandonment rate you’re currently experiencing. Long call wait times do not always tell the whole story. In fact, it’s likely that a combination of a few of them has led to the current state of affairs over time.
Fortunately, there are a variety of call center solutions available that can help you not only overcome high abandonment rates but also have additional teamwork and connectivity benefits in the future.
Although the call abandonment rate formula appears to be simple enough, there are a few common blunders that contact centers make when implementing it.
If this isn’t the case, you’ll possibly experience “poor abandons,” where consumers become annoyed by the music or the sales messaging, or you’ll have exceeded their tolerance for waiting time.
Take all of this into account and adjust your on-hold / IVR plan accordingly.
To lower your Call Abandon Rate, you can employ a variety of strategies. But, to wrap things up, let’s have a look at a few of these concepts.
This may seem self-evident, but callers tend to abandon when there isn’t enough staff available.
Call peaks can often be predicted using historical patterns, and better scheduling can help.
Offering people the option to leave a call-back and then keeping the call in the queue until it reaches an agent is a simple way to avoid call abandonment. This strategy only works if you have sporadic increases in call demand rather than being understaffed all of the time.
People frequently abandon a queue after hearing a message, especially if the message is repeated. You may be able to minimize the number of abandons by changing the wording of your messages (or slowing down the pace of on-hold messages) by noticing the times when people abandon.
Examine the length of your IVR navigation, as well as the number of choices and layers within it. What might be causing people to abandon their studies?
Call abandonment is something that no call centre will ever stop. In a call centre, these things happen all the time. You should, however, keep track of and lower the call abandonment rate, ensuring that all of your callers are well served.
There are a variety of ways you can use to do this. However, there are situations when more than processes and successful call centre software are needed to help you run your business more effectively.
Read more

Introduction to T-tests Use T-tests for statistical survey analysis Get started with Voxco Table of Contents 01 What is a T-test? The T-test is an
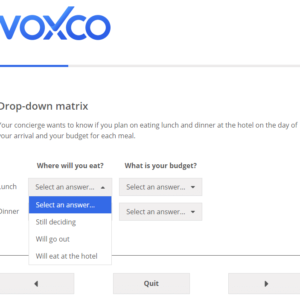
Survey Features Dropdown survey question Engage respondents with easy to answer dropdown questions in your surveys. Get a free evaluation Unlock your Sample Survey Get
Uncovering the Essentials of Research Methodology in Sociology SHARE THE ARTICLE ON Table of Contents Introduction What is a Research Methodology? A research methodology is

How to make noise survey report SHARE THE ARTICLE ON Table of Contents WHAT IS NOISE SURVEY REPORT? A noise survey report is generated following

Understanding the Distinct Worlds of Research & Evaluation SHARE THE ARTICLE ON Table of Contents Research and Evaluation are two totally different disciplines, even if

Survey Features Opinion polls Get a free evaluation Unlock your Sample Survey Get your current survey solution evaluated by our experts. An opinion poll, often
We use cookies in our website to give you the best browsing experience and to tailor advertising. By continuing to use our website, you give us consent to the use of cookies. Read More
| Name | Domain | Purpose | Expiry | Type |
|---|---|---|---|---|
| hubspotutk | www.voxco.com | HubSpot functional cookie. | 1 year | HTTP |
| lhc_dir_locale | amplifyreach.com | --- | 52 years | --- |
| lhc_dirclass | amplifyreach.com | --- | 52 years | --- |
| Name | Domain | Purpose | Expiry | Type |
|---|---|---|---|---|
| _fbp | www.voxco.com | Facebook Pixel advertising first-party cookie | 3 months | HTTP |
| __hstc | www.voxco.com | Hubspot marketing platform cookie. | 1 year | HTTP |
| __hssrc | www.voxco.com | Hubspot marketing platform cookie. | 52 years | HTTP |
| __hssc | www.voxco.com | Hubspot marketing platform cookie. | Session | HTTP |
| Name | Domain | Purpose | Expiry | Type |
|---|---|---|---|---|
| _gid | www.voxco.com | Google Universal Analytics short-time unique user tracking identifier. | 1 days | HTTP |
| MUID | bing.com | Microsoft User Identifier tracking cookie used by Bing Ads. | 1 year | HTTP |
| MR | bat.bing.com | Microsoft User Identifier tracking cookie used by Bing Ads. | 7 days | HTTP |
| IDE | doubleclick.net | Google advertising cookie used for user tracking and ad targeting purposes. | 2 years | HTTP |
| _vwo_uuid_v2 | www.voxco.com | Generic Visual Website Optimizer (VWO) user tracking cookie. | 1 year | HTTP |
| _vis_opt_s | www.voxco.com | Generic Visual Website Optimizer (VWO) user tracking cookie that detects if the user is new or returning to a particular campaign. | 3 months | HTTP |
| _vis_opt_test_cookie | www.voxco.com | A session (temporary) cookie used by Generic Visual Website Optimizer (VWO) to detect if the cookies are enabled on the browser of the user or not. | 52 years | HTTP |
| _ga | www.voxco.com | Google Universal Analytics long-time unique user tracking identifier. | 2 years | HTTP |
| _uetsid | www.voxco.com | Microsoft Bing Ads Universal Event Tracking (UET) tracking cookie. | 1 days | HTTP |
| vuid | vimeo.com | Vimeo tracking cookie | 2 years | HTTP |
| Name | Domain | Purpose | Expiry | Type |
|---|---|---|---|---|
| __cf_bm | hubspot.com | Generic CloudFlare functional cookie. | Session | HTTP |
| Name | Domain | Purpose | Expiry | Type |
|---|---|---|---|---|
| _gcl_au | www.voxco.com | --- | 3 months | --- |
| _gat_gtag_UA_3262734_1 | www.voxco.com | --- | Session | --- |
| _clck | www.voxco.com | --- | 1 year | --- |
| _ga_HNFQQ528PZ | www.voxco.com | --- | 2 years | --- |
| _clsk | www.voxco.com | --- | 1 days | --- |
| visitor_id18452 | pardot.com | --- | 10 years | --- |
| visitor_id18452-hash | pardot.com | --- | 10 years | --- |
| lpv18452 | pi.pardot.com | --- | Session | --- |
| lhc_per | www.voxco.com | --- | 6 months | --- |
| _uetvid | www.voxco.com | --- | 1 year | --- |