Featured Webinar: Harness the Power of AI: Easily Analyze Open-End Responses - November 14 at 2pm ET
Take a peek at our powerful survey features to design surveys that scale discoveries.
Explore Voxco
Need to map Voxco’s features & offerings? We can help!
Get exclusive insights into research trends and best practices from top experts! Access Voxco’s ‘State of Research Report 2024 edition’.
We’ve been avid users of the Voxco platform now for over 20 years. It gives us the flexibility to routinely enhance our survey toolkit and provides our clients with a more robust dataset and story to tell their clients.
Steve Male
VP Innovation & Strategic Partnerships, The Logit Group
Explore Regional Offices
Find the best survey software for you!
(Along with a checklist to compare platforms)
Take a peek at our powerful survey features to design surveys that scale discoveries.
Explore Voxco
Need to map Voxco’s features & offerings? We can help!
Find the best customer experience platform
Uncover customer pain points, analyze feedback and run successful CX programs with the best CX platform for your team.
We’ve been avid users of the Voxco platform now for over 20 years. It gives us the flexibility to routinely enhance our survey toolkit and provides our clients with a more robust dataset and story to tell their clients.
Steve Male
VP Innovation & Strategic Partnerships, The Logit Group
Explore Regional Offices
Get your current survey solution evaluated by our experts.
Cross-tabulation is the most used functionality in data analysis in the market research industry. Also called contingency table analysis, you can use this method when comparing one survey result with another.
Cross-tabs are data tables that help you visualize the entire data of the whole group and the subgroups. You can use the data table to determine the presence of any relationship within the data.
You must have come across tabular layouts of information. Just like the one you see on a report card or the ingredients behind a chips packet. You can see two-dimensional tables spreading out information. In short, the cross-tab states the relationship between variables.
The cross-tabulation analysis is nothing but studying the tabulated information to derive conclusions from it. The cross-tab analysis uses terms like banners, stubs, chi-square statistics, and expected values.
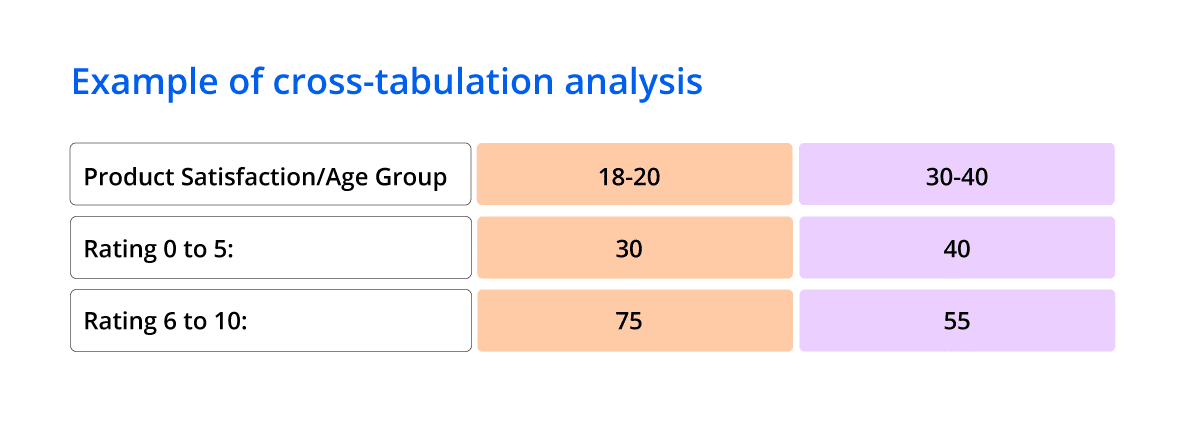
Let’s assume you have recently launched a range of eco-friendly travel bags. You conduct a product experience survey after 3 months of sales on 200 customers to gather feedback.
In this scenario, you can use cross-tabulation to get an in-depth and insightful report. Moreover, you can add an independent variable, such as age, to understand how different age group views your product.
With the data table, you can clearly determine which age group prefers your eco-friendly travel bag more. Moreover, you can identify patterns and trends by comparing the two variables – age and product satisfaction.
Using these insights, you can create targeted campaigns and improve product quality to cater to different age groups.
Convert data to insights in real-time with Voxco Analytics.
See trends with cross-tabs. Uncover behavioral patterns with segmentation. Visualize insightful data with charts.
Surveys can be cross-tabulated only when you have categorized variables or data. Meaning that your data needs to be able to divide into groups having something in common. Let us look at some areas where you can use cross-tabulation analysis for your survey:
You can get to know what employees feel and think about working in your workplace and their job profiles. You can compare variables such as gender or age group and conduct employee engagement survey in various departments.
Conduct surveys when employees are exiting your company. You can tabulate the information and try to figure out the reason behind their exit. You can also examine the correlations between job satisfaction and employees leaving.
You can keep track of customer experience in your business and compare it with their feedback to identify patterns in their behavior. As we explained in the example above, you can use one or more variables and find patterns and relationships between data.
Use cross-tabs to evaluate the likelihood of recommendations between long-term and new customers. Or find out the level of satisfaction between younger and older customers.
Using demographic factors, you can see differences in how people feel about your brand and serve them accordingly.
You can use data tables to visualize large data sets and draw insightful data. You can compare the data against the entire population or specific subgroups.
Understand your market and your competition like never before with Voxco!
Download Competitive Intelligence Guide to learn how you can leverage survey software to stay ahead of the curve.
To define the advantages of cross-tabs, it can help you identify that your products are not performing well only for a specific region. This means that it can help you find patterns, relationships, and trends between variables.
Here are the major advantage of using cross-tab analysis in the survey.
1. Reducing error – It is not always easy to analyze large data and represent them accurately to derive conclusions from them.
Although, with cross-tabulation analysis, your data sets become more manageable, thus reducing any errors. You can interpret the data on a smaller and more manageable scale by dividing the total population into subgroups.
2. Accurate insights – Relationships between variables are represented accurately in cross-tabulation. This allows a straightforward data analysis making it an easy method to gather insights from.
With cross-tabs, it is easier to gain granular data. By creating sub-groups, you can uncover insights that would otherwise go undiscovered if analyzed as a whole data.
3. Quality information – You get a simplified version of your data, only the part that matters the most. By analyzing important data, you get information that is reliable and actionable too.
Cross tabs can help you identify hidden patterns in your survey data. When you use this data analysis functionality with customers’ survey responses, you can create a detailed picture of your target audience. Moreover, the functionality also helps you segment your audience based on recurring patterns, enabling you to develop targeted marketing strategies.
Voxco’ survey software enables you to create and conduct surveys on multiple channels. The platform offers advanced survey analytics software so you can uncover insights and drive change across all areas of your business.
Discover the Latest Cutting-Edge Survey Features for Informed Decision-Making
✓ Drag-and-drop Interface
✓ 40+ Question Types
✓ Skip Logic and Branching
Follow Voxco on