Survey bubble 01

Survey Features

Correlation Analysis

Get your current survey solution evaluated by our experts.

This is a subject that a couple of individuals could recall from measurement illustrations in school, however, most experienced experts will know it as a staple of information analysis. 


Be that as it may, correlations are, as often as possible, misjudged and abused, even in the experience business, for various reasons. So here is a useful manual for the rudiments of correlation analysis.

What is correlation analysis?

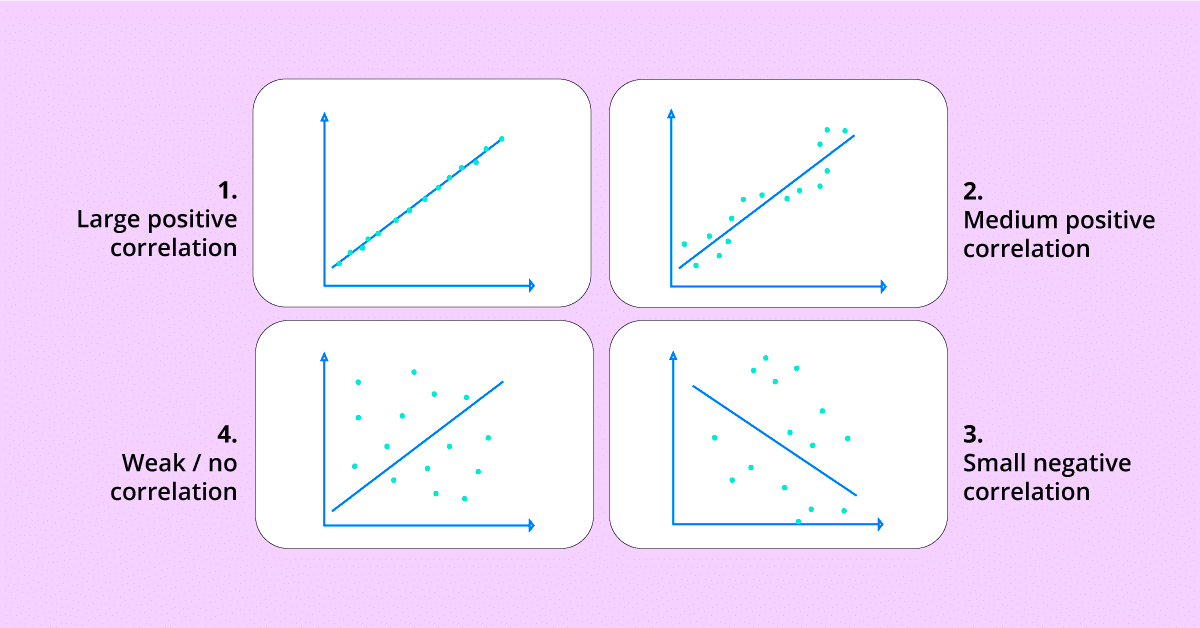
Correlation analysis in research is a factual strategy used to quantify the strength of the direct correlation between two factors and figure out their affiliation. It ascertains the degree of progress in one variable because of the change in the other. A high correlation focuses on a solid correlation between the two factors, while a low correlation implies that the factors are pitifully related.

With regard to statistical surveying, specialists use this strategy to break down quantitative information gathered through research strategies like reviews and live surveys. They attempt to recognize the correlation, designs, huge associations, and patterns between two factors or datasets. 

There is a positive correlation between two variables when an increment in one variable prompts an increment in the other. Then again, a negative correlation implies that when one variable expands, different declines as well as the other way around.

Real-life examples of correlation analysis

Here are the 3 best examples of correlation in life;

Example 1: Air conditioning bills vs. the weather

When it comes to weather, it’s simple to quantify negative correlation because a rise (or drop) in outside temperature influences the use of air conditioners. 

Example 2: Increase in demand vs. price

In the business sector, one example of a positive connection is the demand for and cost of a product. With the demand for a product the price also increases; when demand declines, so does the price. 

Example 3: Health Improvement vs. Medical Dose Reduction

Correlational studies are commonly utilized in clinical trials to understand better how a newly developed medicine affects patients. If the patient’s health improves as a result of taking the medication regularly, there is a positive correlation.

However, if health does not improve or deteriorate, there is no correlation between the two variables, i.e., health and medicine.

Convert data to insights in real-time with Voxco Analytics.

See trends with cross-tabs. Uncover behavioral patterns with segmentation. Visualize insightful data with charts

What are the benefits of Correlation Analysis?

The benefits of correlation analysis are

  • Notice correlations: A correlation assists with distinguishing the nonappearance or presence of a correlation between two factors. It will, in general, be more applicable to day-to-day existence.
  • A decent beginning stage for research: It ends up being a decent beginning stage when an analyst begins researching correlations interestingly.
  • Utilized for additional analysis: Researchers can distinguish the course and strength of the correlation between two factors and thin the discoveries down in later analysis.
  • Basic measurements: Research discoveries are easy to group. The discoveries can go from -1.00 to +1.00. There can be just three expected wide results of the analysis.

What is the significance of Correlation Analysis?

The analysis of correlation shows the bearing and level of correlation between the factors. This has helped the arrangement of various regulations and ideas in financial hypotheses. It is instrumental in getting financial conduct. 

This is useful in concentrating on factors by which monetary occasions are impacted. Analysis of correlation diminishes the scope of vulnerabilities in the matter of forecast. Supportive in analysis and research. It is likewise useful in arrangement definition.

What are the types of Correlations?

  • High and Low Correlation

High correlation depict a more grounded correlation between two factors, wherein an adjustment of the first has a nearby correlation with an adjustment of the second. 

A low correlation portrays a more vulnerable correlation, implying that the two factors are most likely unrelated.

  • Positive, Negative, and No Correlation

A correlation in measurements means a straight correlation.

Correlation Analysis: Definition,Use, Benefits, Significance, Types and Factors Affecting Correlation Analysis

Positive– A positive correlation implies that this straight correlation is positive, and the two factors increased or lessened in a similar heading. 

Negative– A negative correlation is an exact inverse, wherein the correlation line has a negative slant and the factors move opposite to one another, i.e., one variable reduces while different increases. 

No correlation– No correlation essentially implies that the factors act contrastingly and, along these lines, have no linear correlation.

Read how Voxco helped HRI conduct complex research & accelerate insight generation.

What are the degrees of Correlation Analysis?

We can quantify the degree of correlation between two factors through the correlation coefficient. We can likewise decide if the correlation is positive or negative and its certificate or degree based on the coefficient of correlation.

  1. Perfect correlation: If two factors shift in a similar course and to a similar extent, the correlation between the two is a wonderful positive. As indicated by Karl Pearson, the coefficient of correlation for this situation is +1. Then again, assuming that the factors shift on the contrary course and to a similar extent, the correlation is wonderfully negative. Its coefficient of correlation is – 1. Practically speaking, we seldom go over these kinds of correlations.
  2. Non Appearance of correlation: If two series of two factors show no relations between them or a change in one variable doesn’t prompt an adjustment of the other variable, then, at that point, we can immovably say that there is no correlation or ludicrous correlation between the two factors. And In this case, the coefficient of correlation is 0.
  3. Restricted levels of correlation: If two factors are not impeccably associated, or there is an ideal shortfall of correlation, then, at that point, we term the correlation as Limited correlation. Hence Correlation might be positive, negative, or zero yet lies with the cutoff points ± 1. For example, the worth of r is to such an extent that – 1 ≤ r ≤ +1. The + and – signs are used separately for positive straight correlations and negative direct correlations.4

What are the different kinds of correlation analysis?

Here are the 2 types of correlation analysis;

  • Spearman correlation
  • Pearson correlation

1. Spearman correlation

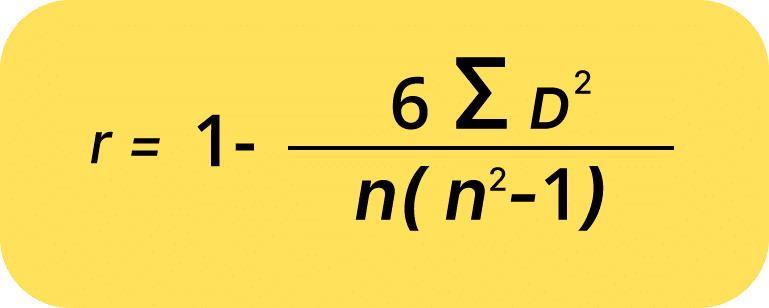
This coefficient is used to determine whether or not there is a significant association between the two datasets. It is based on the premise that the data being utilized is ordinal, which implies that the numbers do not represent quantity, but rather a position of place of the subject’s status (e.g., 1st, 2nd, 3rd, etc.)

Correlation Analysis: Definition,Use, Benefits, Significance, Types and Factors Affecting Correlation Analysis

This coefficient can be displayed on a data table to demonstrate the raw data, its rankings, and the difference between the two ranks. 

This squared difference between the two rankings can be visualized on a scatter graph, indicating whether there is a positive, negative, or no correlation between the two variables. The constraint under which this coefficient operates is -1 r +1, with a result of 0 indicating no relationship between the variables. 

When to use this correlation analysis:  Where data must be handled regarding population or probability distribution characteristics. It is typically used with quantitative data already established inside the parameters.

2. Pearson correlation

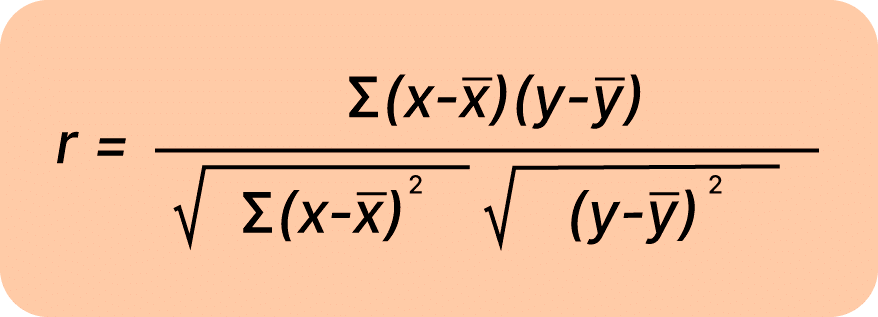
It assesses the strength of the ‘linear’ correlations between the raw data from both variables rather than their rankings. Because this is a dimensionless coefficient, there are no data-related limits to consider while doing studies using this formula, which is why it is the first formula researchers test.

Correlation Analysis: Definition,Use, Benefits, Significance, Types and Factors Affecting Correlation Analysis

If the link between the data is not linear, then this coefficient will not effectively describe the relationship between the two variables, and Spearman’s Rank must be used instead. 

Pearson’s coefficient requires the required data to be entered into a table similar to Spearman’s Rank but without the ranks, and the result will be in the numerical form that all correlation coefficients, including Spearman’s Rank and Pearson’s Coefficient, produce: -1 ≤ r ≤ +1.

When to use: When no assumptions about the probability distribution may be made. Typically applied to qualitative data, but can be applied to quantitative data if Spearman’s Rank is insufficient.

Stay ahead of the curve with data-driven insights.

Download Market Research Toolkit.  

  • 5 Market Research Templates 
  • Guide to Agile Market Research
  • Guide to using Online surveys to conduct Market Research

What are the factors that affect a Correlation Analysis?

Several factors must be thought about when a correlation analysis is arranged. These include

  1. You should not analyze correlations when information is rehashed proportions of a similar variable from a similar person at the equivalent or changed time focus. 
  2. It is valuable to draw a dispersed plot as it helps to glance and uncover exceptions, non-linear relationships, and heteroscedasticity.
  3. You shouldn’t perform this analysis if there is a non-linear relationship between the quantitative variables.
  4. The example size ought to be suitably determined a priori.

Conclusion

Correlation analysis is only sometimes used alone and is usually joined by the relapse analysis. 

The contrast between correlation and relapse lies in the way that while an analysis stops with the estimation of the correlation coefficient and maybe a trial of importance, a relapse analysis communicates the correlation as a situation and moves into the domain of expectation.

Discover the Latest Cutting-Edge Survey Features for Informed Decision-Making

✓ Drag-and-drop Interface 

✓ 100+ Question Types 

✓ Skip Logic and Branching

Voxco is trusted by Top 50 Market Research firms, Global Brands & Universities in 40 countries. Voxco offers full omnichannel capability including CATI, Predictive Dialler, Online surveys, offline CAPI, and Panel Management.

Follow Voxco on