Survey bubble 01

Survey Features

Top 2 Box Scores

Get started with Voxco’s ultimate guide to sampling methods

In the influence of an external standard or historical norms, it might be difficult to interpret rating scale data. The top 2 box scoring strategy is a prominent technique used by marketers to assess rating scale data nowadays.

Here we’ll discuss the top 2 box scores, their objectives, variations, and benefits. Let’s get started.

What are the Top 2 Box Scores?

The top 2 box score is a standard technique for scoring and evaluating data from customer satisfaction surveys. It is a method of summarizing affirmative responses to Likert scale survey questions. It adds the top two responses and gives you a single/ combined value.

This data analysis method consolidates the top two responses, i.e., the highest two ratings of a Likert scale or a rating scale. The top two boxes represent the positive response categories, and analyzing these responses allows you to capture the positive outcome. 

For example, let’s say you use a 5-point scale to evaluate customer satisfaction. The scale ranges from “strongly disagree” to “strongly agree,” with the top two boxes being “strongly agree” and “agree.” The analysis will therefore focus on identifying the percentage of survey respondents who choose these two responses. 

The top 2 box score analysis method enables you to identify the strength based on the respondents demonstrating positive sentiment. You get a consolidated measurement of satisfaction and approval from respondents, enabling a quick evaluation of the positive performance. 

The data analysis method is widely used due to its effectiveness and efficiency. The benefit of utilizing a top 2 box score is that it allows researchers to concentrate on a single measure rather than dealing with and interpreting answer percentages for each particular scale category. This method is helpful when your goal is to compare performance across different segments or over time.

Objectives of Top 2 Box Scores

Top 2 box score is important for organizational growth because

  1. It makes your data easily accessible. Instead of evaluating five or more figures, you’ll simply have one to assess.
  2. Comparisons are simple and efficient. This scoring allows you to compare findings more effectively when comparing outcomes across brands or stimuli.
  3. Trends become more obvious. Top 2 Box scores assist you in identifying trends in your data while tracking metrics over time.

Now that you have learned about the meaning and objectives of the top 2 box scores. Let us now explore some variations of it.

Convert data into actionable insights.

See how Voxco Analytics can help you unlock the power of data by helping you build striking visual stories and cross tabs.

Variations of Top 2 Box scores

Some of the common variations of top 2 box scores are

  1. Top Box Score
  2. Bottom 2 Box Score
  3. Top 3 Box Score

Let’s learn about them in detail.

Top Box Score

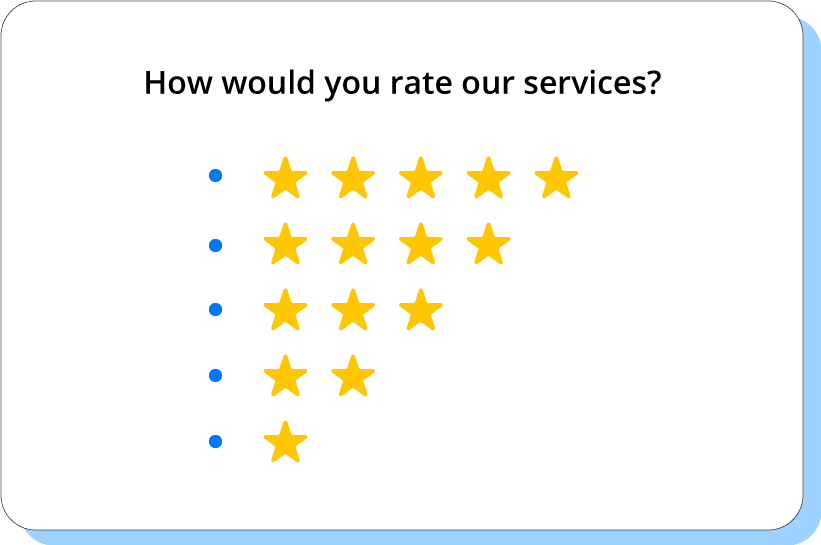
When you’re just interested in analyzing the top box, use a Top Box score. Simply find the percentage of participants you have selected 5 stars or the top-most choice from the response options. So, your top box score will be 60% if 60% of your total respondents have given you 5 stars. 

For example, say your aim is to boost customer retention, you can use a star-rating question to gauge satisfaction. This will help you focus your campaign on increasing the percentage of consumers who rated 5 stars over time.

Top 2 Box Scores Top 2 Box Scores

Bottom 2 Box Score

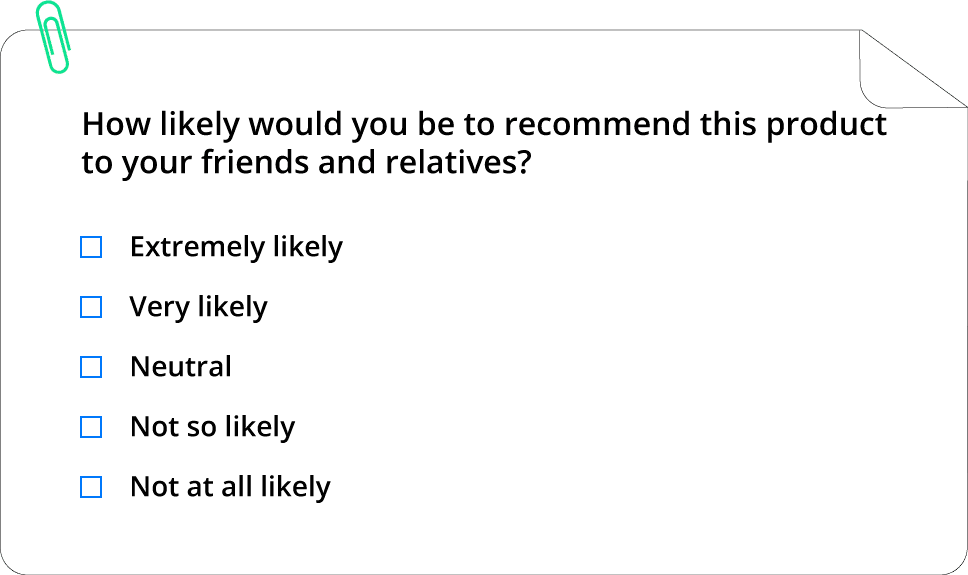
When attempting to collect negative responses out of a Likert scale question, a Bottom 2 Box may be used instead of a Top 2 Box.

It’s as simple as adding the bottom two responses (“Extremely likely” and “Not at all likely”). By quantifying the negative responses you can deduce the percentage of loyal customers. 

Top 2 Box Scores Top 2 Box Scores

Top 3 Box Score

When Likert scale questions exceed a 5-point scale, use a Top 3 Box score. The formula is identical to the Top 2 Box, except that you add the top three positive responses.

Read how Voxco helped HRI conduct complex research & accelerate insight generation.

Benefits of using Top 2 Box Score

This data analysis method is easy to interpret and identify the positive outcomes. Let’s look at some of its advantages that contribute to its importance. 

1. Simplicity and ease of interpretation:

With the focus only on the top two ratings, the analysis offers a concise representation of the data. It makes it easy for you to interpret the result without losing focus on the pile of numbers. The simplicity of analyzing 2 of the topmost responses allows you to grasp the overall feeling of the respondents quickly. 

2. Uncovering positive outcomes:

The top 2 box score analysis enables you to identify the positive and negative results. You can determine the percentage of participants who share the approving sentiment with your survey question. This allows you to uncover strengths and priorities your focus on enhancing them. 

3. Standardized data:

The analysis method follows a systematic approach which provides consistency in the evaluation process. Organizations establish a standard for assessing satisfaction or performance using this evaluation. This standardization allows you to compare the data over time and track progress enabling you to identify areas that require further improvements.

Top 2 Box Score analysis: application

You can use this data analysis method for market research and customer experience. Let’s see how this method applies to the two use cases. 

1. Market research:

In today’s competitive landscape, understanding customers’ perceptions of the brand and the product/service performance is important to drive business growth. This is where top 2 box score analysis plays a vital role. 

  • It helps you measure customer satisfaction effectively, enabling you to gauge their perception of your brand. 
  • You can monitor brand perception by identifying the customers who have positive/favorable views of your brand. 
  • The score enables you to assess the quality of the products/services based on customers’ ratings. 

2. Customer experience:

Customer experience is a prime factor of a successful business. Ensuring a high satisfaction level helps foster a deeper relationship with customers leading to an increase in customer loyalty

  • Tracking positive sentiment on customer satisfaction enables you to identify repurchase intention and, by extension, their loyalty. 
  • Use the report to evaluate the impact of interventions. Assess whether the changes you have made had any positive influence on CX.
  • Identify areas of improvement by uncovering the areas that did not lead to customer satisfaction.

Voxco helps the top 50 MR firms & 500+ brands gather actionable insights and make data-driven decisions.

See what Voxco can do for you with a personalized demo.

Conclusion

Top box scoring enables you to rapidly identify your company’s strengths as well as key areas that require immediate attention. With this information, you can build on the aspects that keep customers coming back while also addressing weaknesses. Responding to survey data from customers keeps them coming to you instead of your competitors down the block.

FAQ

1. How do you calculate the top 2 box score?

Here is a general approach to calculating the top 2 box score: 

  • Identify the top two response categories. For example, on a 5-point scale, the top two responses should be ‘strongly satisfied’ and ‘satisfied.’ 
  • Keep track of the total number of responses that fall within the top two boxes. 
  • Divide the count of responses in the top 2 boxes by the total number of responses. Multiple by 100 to calculate the percentage. 

2. What is a top 1 box score?

The top 1 box score tells you about the percentage of respondents who select the highest rating category. Similar to the top 2 boxes, the highest response in the top 1 box is also generally the most positive option.

3. What does the top 2 box score mean?

The top 2 box scores identify the respondents who choose the top two response options of a rating scale or Likert scale survey. It simplifies the data analysis by focusing on analyzing the percentage of the top two box scores. 

4. What does the top box percentage mean?

The top box percentage indicates the percentage of respondents who fall into the group of respondents who have selected the highest rating. It represents the respondents who have favorably endorsed to your survey question or statement.

Experience Innovative Survey Features and Drive Informed Decision-Making with Voxco Insights

✓ Drag-and-drop Interface 

✓ 100+ Question Types 

✓ Skip Logic and Branching

Voxco is trusted by Top 50 Market Research firms, Global Brands & Universities in 40 countries. Voxco offers full omnichannel capability including CATI, Predictive Dialler, Online surveys, offline CAPI, and Panel Management.

Follow Voxco on