Voxco and Ascribe Join Forces to Enhance Your Research Capabilities
Take a peek at our powerful survey features to design surveys that scale discoveries.
Explore Voxco
Need to map Voxco’s features & offerings? We can help!
Get exclusive insights into research trends and best practices from top experts! Access Voxco’s ‘State of Research Report 2024 edition’.
We’ve been avid users of the Voxco platform now for over 20 years. It gives us the flexibility to routinely enhance our survey toolkit and provides our clients with a more robust dataset and story to tell their clients.
Steve Male
VP Innovation & Strategic Partnerships, The Logit Group
Explore Regional Offices
Find the best survey software for you!
(Along with a checklist to compare platforms)
Take a peek at our powerful survey features to design surveys that scale discoveries.
Explore Voxco
Need to map Voxco’s features & offerings? We can help!
Find the best customer experience platform
Uncover customer pain points, analyze feedback and run successful CX programs with the best CX platform for your team.
We’ve been avid users of the Voxco platform now for over 20 years. It gives us the flexibility to routinely enhance our survey toolkit and provides our clients with a more robust dataset and story to tell their clients.
Steve Male
VP Innovation & Strategic Partnerships, The Logit Group
Explore Regional Offices
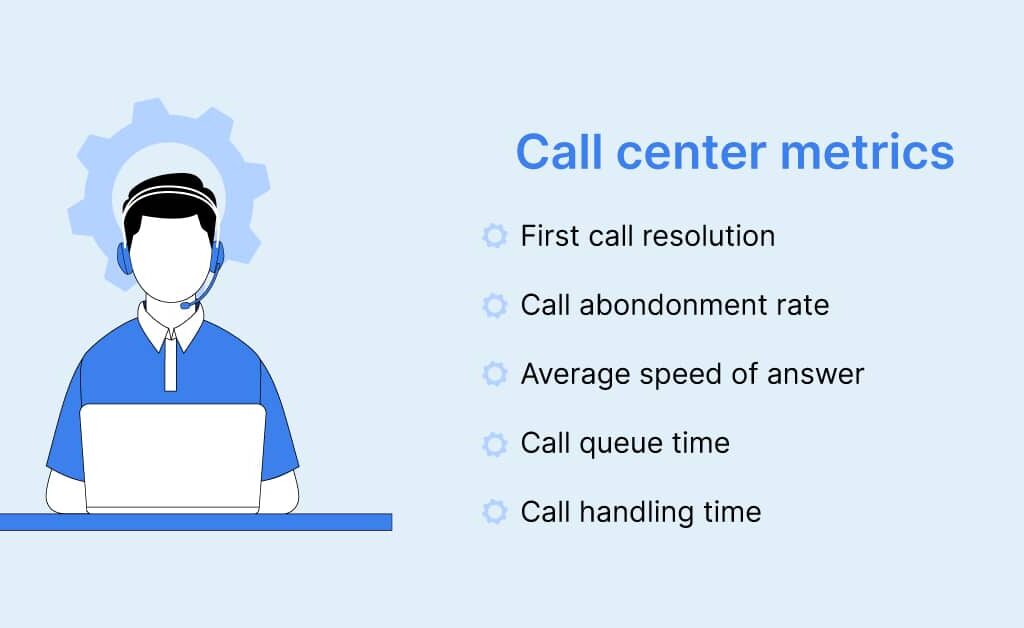
Call Center Metrics are parameters that are monitored for the purpose of maintaining a flawless operation in customer service. These metrics are also called Key Performance Indicators (KPI). Call center managers regularly evaluate these factors to monitor trends and patterns.
The list of these Call Center Metrics is as follows.
01
Many callers receive a busy tone when they dial your contact center’s number. This is defined as the Percentage of Calls Blocked.
This indicates that your agents are losing prospects as well as opportunities to help customers. This can lead to customer frustration because they are unable to get the assistance they want.
If your call block rate is high, it could be due to the low volume of agents. You can use this metric to determine why agents cannot provide the service and fix it before it upsets more customers.
Average Time in Queue is the amount of time a caller is kept waiting in the line. You can calculate it by dividing the total time callers are made to wait in the queue by the total number of calls answered.
Measuring this metric can help you understand why the agents have to put callers on hold. This way, you can aim towards improving the customer experience. The call center can also offer the feature of call back to minimize the time spent in the queue.
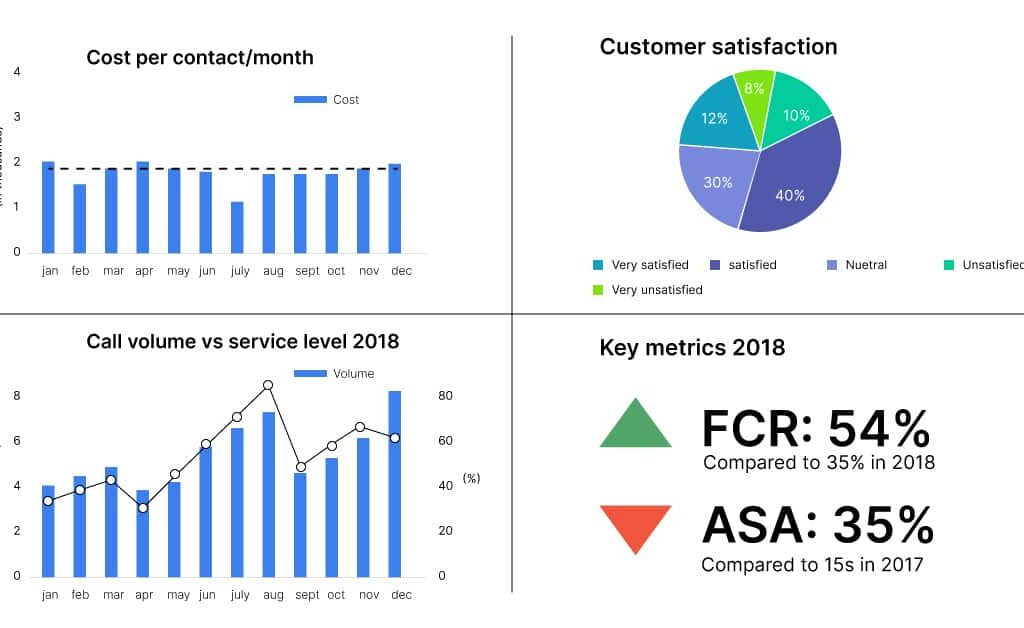
Service level measures the percentage of calls an agent answers within a set time period. It is one of the best metrics to analyze how fast your agents answer a call. The industry average service level is answering 80% of calls in the first 20 seconds.
These metrics keep in check that the calls move from one to the next smoothly and that most of the calls are efficiently answered. Let your agents know the service level your call center aims for and motivate them to keep it within the range.
The average speed of answers, as the name suggests, is a metric that measures the speed of answering calls. It calculates the amount of time an agent takes to answer a call within a time frame.
In case the ASA rate is high, it can indicate that your agents are not fast enough to answer calls. Figure out what is the reason behind the delay in responding. You should also take a look at the software you are using and advance them to the latest version to smoothen the workflow.
AHT = Talk time + Hold time + Wrap time / Total number of Calls
AHT is the most essential metric that indicates how your call center is performing. From the moment an agent picks up the call until they are done updating data onto the system is considered when measuring Average Handle Time.
If an agent’s handle time is too long, it suggests that they are having trouble managing the customer. This may mean they are having trouble resolving queries or updating the system during wrap time.
If an agent’s handle time is too short, it indicates that the agent is not providing efficient service to the customer. This means that the agent is not offering complete assistance to the caller. It may also mean that they are not doing the after-call work properly.
You can regularly monitor the calls and use quality assurance software to ensure that the agents are maintaining the target AHT of the Call Center.
To provide excellent customer service, your customers need to stay on the phone. When a caller hangs up the call before they are connected to an agent is called a Call Abandonment Rate.
Based on the overall call abandonment of the call center, this metric can give a lot of information about the agent’s performance. You can look for issues that affect your agents, causing a high call abandonment rate. The metrics can also indicate that your telephony system may be out of date.
Figure out why the rate is high and how it is affecting your customer satisfaction.
Customer satisfaction is the most influential metric. If your customers are satisfied, it can lead to the success of your brand. If they are unsatisfied, it can bring your brand down.
While all the other metrics tell you the issue from within the call center, Customer Satisfaction gives you a picture of how your customers think you are performing.
It is usually determined by conducting a survey or collecting feedback. Customer satisfaction tells you how your customers feel about their journey with your company. The customer’s view on how your agents can satisfy their needs and what more they expect.
It is often advised to conduct customer satisfaction surveys regularly to keep the customers involved. This also makes them feel valued by the brand.
This metric helps call center management to understand if the agents are available to take the calls and how much time they spend resolving them. In this way, managers can know if the agents are following their schedule or not.
Also, call availability helps the management identify the peak hour of operation. The managers can adjust the staff level and schedule to meet the increase in the volume of calls.
Survey organizations around the world have maximized their phone survey ROI with the advanced features, hosting options, seamless telephony integration, and flexible pricing of our CATI software.
02
The time after a call that an agent spends in updating customer information in the database is known as after-call work time. The average time spent in ACW is 60 to 120 seconds. You need your agents to update accurate and detailed data about your customers on the database.
However, if you find that the average time spent on ACW is too high, it may harm the agent’s productivity. Figure out if the agents are having trouble navigating through the system when updating data or are using the time to idle. Fix an issue that can cause high ACW time.
To measure your customer service performance, FCR is the most efficient metric. This metric tells you how effectively and accurately your call center agents resolve customer’s issues in the First Call.
If the calls are transferred to superior or other agents and scheduled for callbacks or follow-ups, you need to find out how to reduce this.
Some complex calls may need callbacks or transfers. However, if this has become a pattern, you need to train your agents to give quality service the first time around.
Contact quality examines a call center agent on attributes like courtesy, professionalism, the accuracy of the information, and efficient data collection. It is one of the most common metrics used in the call center industry.
Quality control specialists record this metric by analyzing the call recording of the agents. This metric helps figure out which agent needs more training.
This metric is vital for small-scale call centers. It measures the percentage of time that agents are on schedule when compared to their designated hours. In the case of small call centers, if 3 out of 15 agents are late, this can impact negatively.
It is better to discuss this directly with the agents and design a schedule that does not harm the call center.
Case Volume can be understood as the number of calls that a call center agent handles during their shift. Call centers usually set a quota for each agent on a daily basis. This is to ensure that agents are not spending too much time on one call and are taking more calls.
Too much spent on one call can lead to missed opportunities. Also, long calls are costly and can harm the company’s revenue.
The call transfer rate shows the percentage of calls an agent solves on their own without the help of their colleague or superior. Transferring of calls can frustrate your customer and lead to call abandonment. While you want your team to work together, you also don’t want to upset your customer.
89% of callers have reported that they get frustrated when they have to repeat their issue to a different agent.
Now that we have determined what these call Center Metrics are, let’s take a look at some of the practices you can adopt in your call center to help achieve the most out of it.
See what our clients say about Voxco
See what question types are possible with a sample survey!
03
When looking at the big picture, you may get lost if there is no context attached to it. You may be well aware that this information can help your call center gain success, but you may not understand where to begin without a proper goal.
Figure your goal. What exactly do you want from these metrics? DO you want to reduce call abandonment? Increase service level?
Make a clear goal and share it with your team. Analyze the metric you are targeting and devise a plan to succeed.
Comparing metrics that influence each other can give you a clearer picture of what is going on. Compare your AHT with Call Abandon Rate. This can help you understand if your customers are happy or not.
High AHT with a high call abandon rate indicates customers are not satisfied with your service. Comparing metrics like this can help you identify new opportunities and improve call center performance.
Try to collect data of all kinds when analyzing call center metrics. Sometimes a call can take more time than the standard to complete a query.
From the quantitative perspective, it is an issue of productivity. However, from a qualitative point of view, customer satisfaction after the call outweighs the quantitative statistics.
This shows the agent’s dedication who went the extra mile to give the customer a quality level of service. The customer feels most valued and satisfied when an agent focuses on them and gives them accurate and efficient service.
Sharing all the data you have gathered and your findings with the agents can motivate the team to achieve the goals you have set. Transparency among team members is the most important.
The agents should be aware of how their performance impacts the call center performance. They should recognize their role in the company and how their contribution helps the company achieve success. This can motivate the underperformers and boost their confidence to perform better.
Learn how to meet respondents where they are, drive survey completion while offering a seamless experience, Every Time!
Switch to Voxco Telephony System to improve your Call Center Productivity by 400% or more
Survey organizations around the world have maximized their phone survey ROI with the advanced features, hosting options, seamless telephony integration, and flexible pricing of our CATI software.
04
Metrics are indicators that help you understand how accessible your call center is to your customers. Additionally, it tells you how many agents are required to provide quality service.
KPI or Key Performance Indicator illustrates how efficiently the company, department, team, or agent is achieving the target business goal.
Common Quality parameters in a Call Center are
We use cookies in our website to give you the best browsing experience and to tailor advertising. By continuing to use our website, you give us consent to the use of cookies. Read More
Name | Domain | Purpose | Expiry | Type |
---|---|---|---|---|
hubspotutk | www.voxco.com | HubSpot functional cookie. | 1 year | HTTP |
lhc_dir_locale | amplifyreach.com | --- | 52 years | --- |
lhc_dirclass | amplifyreach.com | --- | 52 years | --- |
Name | Domain | Purpose | Expiry | Type |
---|---|---|---|---|
_fbp | www.voxco.com | Facebook Pixel advertising first-party cookie | 3 months | HTTP |
__hstc | www.voxco.com | Hubspot marketing platform cookie. | 1 year | HTTP |
__hssrc | www.voxco.com | Hubspot marketing platform cookie. | 52 years | HTTP |
__hssc | www.voxco.com | Hubspot marketing platform cookie. | Session | HTTP |
Name | Domain | Purpose | Expiry | Type |
---|---|---|---|---|
_gid | www.voxco.com | Google Universal Analytics short-time unique user tracking identifier. | 1 days | HTTP |
MUID | bing.com | Microsoft User Identifier tracking cookie used by Bing Ads. | 1 year | HTTP |
MR | bat.bing.com | Microsoft User Identifier tracking cookie used by Bing Ads. | 7 days | HTTP |
IDE | doubleclick.net | Google advertising cookie used for user tracking and ad targeting purposes. | 2 years | HTTP |
_vwo_uuid_v2 | www.voxco.com | Generic Visual Website Optimizer (VWO) user tracking cookie. | 1 year | HTTP |
_vis_opt_s | www.voxco.com | Generic Visual Website Optimizer (VWO) user tracking cookie that detects if the user is new or returning to a particular campaign. | 3 months | HTTP |
_vis_opt_test_cookie | www.voxco.com | A session (temporary) cookie used by Generic Visual Website Optimizer (VWO) to detect if the cookies are enabled on the browser of the user or not. | 52 years | HTTP |
_ga | www.voxco.com | Google Universal Analytics long-time unique user tracking identifier. | 2 years | HTTP |
_uetsid | www.voxco.com | Microsoft Bing Ads Universal Event Tracking (UET) tracking cookie. | 1 days | HTTP |
vuid | vimeo.com | Vimeo tracking cookie | 2 years | HTTP |
Name | Domain | Purpose | Expiry | Type |
---|---|---|---|---|
__cf_bm | hubspot.com | Generic CloudFlare functional cookie. | Session | HTTP |
Name | Domain | Purpose | Expiry | Type |
---|---|---|---|---|
_gcl_au | www.voxco.com | --- | 3 months | --- |
_gat_gtag_UA_3262734_1 | www.voxco.com | --- | Session | --- |
_clck | www.voxco.com | --- | 1 year | --- |
_ga_HNFQQ528PZ | www.voxco.com | --- | 2 years | --- |
_clsk | www.voxco.com | --- | 1 days | --- |
visitor_id18452 | pardot.com | --- | 10 years | --- |
visitor_id18452-hash | pardot.com | --- | 10 years | --- |
lpv18452 | pi.pardot.com | --- | Session | --- |
lhc_per | www.voxco.com | --- | 6 months | --- |
_uetvid | www.voxco.com | --- | 1 year | --- |