Voxco and Ascribe Join Forces to Enhance Your Research Capabilities
Take a peek at our powerful survey features to design surveys that scale discoveries.
Explore Voxco
Need to map Voxco’s features & offerings? We can help!
Get exclusive insights into research trends and best practices from top experts! Access Voxco’s ‘State of Research Report 2024 edition’.
We’ve been avid users of the Voxco platform now for over 20 years. It gives us the flexibility to routinely enhance our survey toolkit and provides our clients with a more robust dataset and story to tell their clients.
Steve Male
VP Innovation & Strategic Partnerships, The Logit Group
Explore Regional Offices
Find the best survey software for you!
(Along with a checklist to compare platforms)
Take a peek at our powerful survey features to design surveys that scale discoveries.
Explore Voxco
Need to map Voxco’s features & offerings? We can help!
Find the best customer experience platform
Uncover customer pain points, analyze feedback and run successful CX programs with the best CX platform for your team.
We’ve been avid users of the Voxco platform now for over 20 years. It gives us the flexibility to routinely enhance our survey toolkit and provides our clients with a more robust dataset and story to tell their clients.
Steve Male
VP Innovation & Strategic Partnerships, The Logit Group
Explore Regional Offices
SHARE THE ARTICLE ON
In the industry, Call Centers, performance metrics, and resulting numbers are a challenging task faced by the managers. Theoretically, one cannot understand the achievements in the field of the call center. The managers have come up with techniques to quantify the results. The results indicate the improvement or decline in the performance of the call center in clear numbers.
In simpler terms, Call Center Service Level can be defined as The number of services that can be measured provided to a customer in a defined period. There still needs to be some clarification with different formulas and definitions. However, in a call center, managers mostly measure the percentage of inbound calls answered by agents in a set time period.
Calculating service levels in a call center is debatable. The rate can change when a different formula is employed to calculate. Hence, the result is subjected to being manipulated.
The formula that is generally used to measure service level is based on
X % of calls that should be answered within Y seconds [ X/Y x 100%].
It is important to reach the desired Service Level set by the Call Center. Hence, service levels should be quantified and met more frequently than once a month.
The call center service level indicates your seamless strategy for managing customers and ensuring the availability of agents for callers. There are different formulas you can use to calculate it, which we will discuss in the next section.
Before diving into the service level formula, let’s look into two parts that comprise the service level agreement concept.
When you talk about performance and measurement, you should stray by defining a goal. The service level objective will help you track your performance.
Once you have determined the objective, you can regularly track and measure the service level you achieve against it. You can evaluate the team’s performance to understand the bottlenecks.
Before we discuss service level calculation, let’s identify three key components of this concept.
The time it takes for an agent to answer a customer’s call factors in determining customer satisfaction. Lower response time often leads to high service levels.
The percentage of callers who abandon a call before speaking to an agent suggests customer dissatisfaction with the wait time. Higher abandonment rates negatively impact service levels.
This metric indicates the percentage of time your agents spend engaging with the customers. High occupancy may seem efficient but can cause burnout and a decrease in service quality. Balanced occupancy essentially leads to maintaining service levels.
Let’s understand how to calculate service level. Also, look at other formulas used in the industry of Call Center.
There are 5 ways to calculate the call center service level. Below are the five service-level formulas that you can leverage, however, you will need the following components for the calculation.
The simplest and most widely used formula is the same as mentioned above.
Number of calls answered in the time period/numbers of calls answered X 100%
**However, you should take note that this formula does not take the number of abandoned calls into consideration.
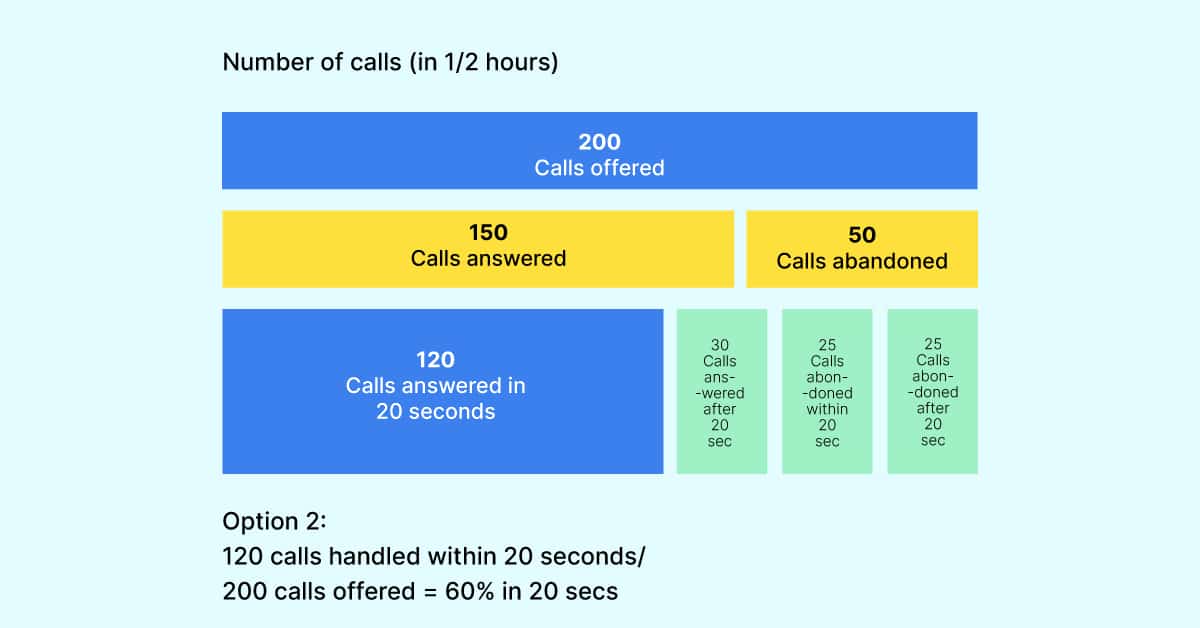
This formula takes the answered and abandoned calls into consideration for calculation. The calls abandoned within the threshold are deemed positive.
Calls answered in time period + calls abandoned in time limit / total calls answered + total calls abandoned X 100%
In contrast to the 2nd formula, this one considers the abandoned calls as negative.
Total calls answered in time limit/ total calls answered + total calls abandoned X 100%
Maximize phone survey ROI with the advanced features, hosting options, seamless telephony integration, and flexible pricing of our CATI software.
This formula ignores the number of calls abandoned within the threshold. The calls abandoned after the set time period are considered to affect the result.
Total calls answered in time period / total calls answered + total calls abandoned after time period X 100%
This formula includes short calls. For example, the number of calls abandoned within 5 seconds, as mentioned in the data.
Total calls answered within time period + calls abandoned within a shorter time than the time limit / total calls answered + total calls abandoned X 100%
Service Level, when calculated frequently and defined clearly, can help the call center management to make a data-driven decision. However, it may be confusing to establish how to measure the Service Level for their Call Center.
Hence, the best practices you can follow are
Decide how to consider the abandoned calls; should they be counted or ignored?
Based on the kind of result you want and the kind of data you want to include, select your formula. Finding the ideal formula that works best for the objective of your call center would keep the calculation simple and clarify the result.
Depending on the volume of calls in your call center and the needs, decide the time interval. The time interval also impacts the result of service level.
It is ideal to monitor the service level of your call center continuously. But, it may not be possible so you decide on the frequency of measuring service level that can effectively reflect the operation of your call center.
It is important for a business to establish a service level. The service level objective should involve customer expectations, wait time, needs, and other factors that affect customer satisfaction.
It is essential that all the departments present their service level data. Different departments may have different volumes of calls and so, the formula used may end up being different. For instance, the billing department may have longer calls than inquiries about addresses.
It is of utmost importance that your result is accurate in order to improve the performance of the call center. Leverage the right telephony software that logs in performance data of individual agents and the project.
Service Level can have an impact due to longer calls, incorrect schedules, different call volumes, etc. it is important to figure out what the issues are and study them before designing an action plan.
Service Level is impacted by each and every employee that works in a call center. It should be displayed to the entire staff. This will help the agents understand the objective of the business and motivate them to achieve it.
You can’t collect data and not take necessary action. The management should take full advantage of the data and analyze it to formulate plans to improve the performance.
Moreover, the industry of call centers is always changing. Therefore, the service goal should also be changed and adapted according to the market.
Hence, it is essential to find the right software that can process all the data. Also, the tool should help you in making proper adjustments in regard to your call center’s measurement.
Fill out a short form & our team will contact you with the details.
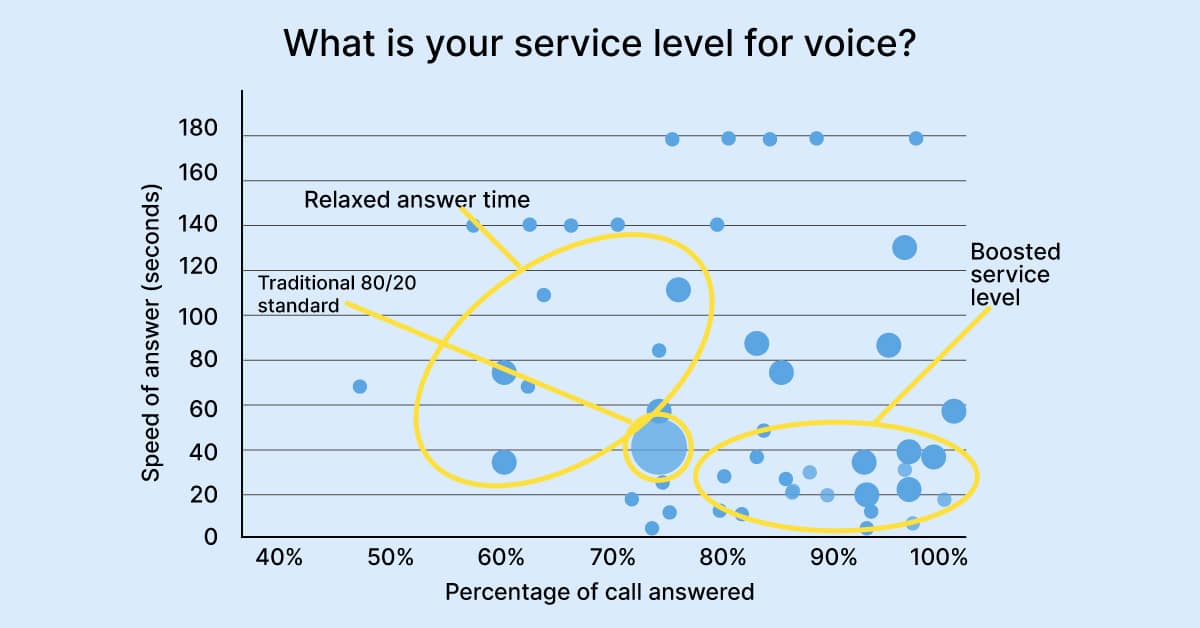
It has been a traditional standard for the entire call center industry to target answering 80% of calls within 20 seconds.
However, many call centers are moving away from this standard. Some call centers choose to relax their target time, while there are call centers that have boosted it to a high percentage.
These contact centers may have identified that changing their SLA can impact their customer satisfaction. In the graph, these contact centers mostly show up around 70/20 and 80/60 data points.
However, if you want to follow this example, you need to ensure that you won’t lose too many calls. It is better to check the impact service level has on the abandoned calls in your call center before changing your SLA.
Many call centers, on the other hand, seem to have researched more about their customer base. The call center has experimented and established how customer satisfaction and abandon call rates vary when they change their service level.
In different sectors, the customers waiting times may differ widely. It seems that these call centers are plotting the abandoned call rates against their set SLA and forming an abandon curve. Then, depending on customer satisfaction, brand value, and staff, set the “abandon ceiling” of 2 and 5% to an SLA.
Gather, measure, uncover, and act on real-time data.
A 3-minute service level agreement may be efficient for retail customer service but not for a healthcare service line. Customers expect prompt and efficient service, and a high service level aligns with their expectations.
A quick response demonstrates your commitment to customer service and fosters positive sentiment. Understanding customer satisfaction and tailoring service level goals accordingly helps you meet and exceed customer expectations.
Evaluate service levels with customer satisfaction scores to understand how your team is performing toward your objective.
It’s important for customer satisfaction that ideal service levels are observed in call centers, yet this is accompanied by difficulties. Given varying call volumes along with technological limitations, there is a necessity for proactivity in handling such hindrances. Service quality in call centers can be enhanced and business growth achieved by setting service level goals in accordance with client expectations and utilizing modern technology.
Service level is typically calculated as the percentage of calls answered within a specified time frame, using formulas that consider answered and abandoned calls.
Service level refers to the measure of how efficiently a call center handles incoming calls, particularly in terms of answering them within a defined time period.
Service level formulas vary, but they generally involve dividing the number of calls answered within a specified time period by the total number of calls (answered and abandoned), then multiplying by 100%.
In supply chain management, services that are offered are frequently appraised in terms of the items delivered on time compared to the total number of items bought where they are expressed as a percentage.
Determining service level involves considering factors such as customer expectations, call volume, response time targets, and industry standards. It’s important to strike a balance between meeting customer needs and operational efficiency.
We use cookies in our website to give you the best browsing experience and to tailor advertising. By continuing to use our website, you give us consent to the use of cookies. Read More
Name | Domain | Purpose | Expiry | Type |
---|---|---|---|---|
hubspotutk | www.voxco.com | HubSpot functional cookie. | 1 year | HTTP |
lhc_dir_locale | amplifyreach.com | --- | 52 years | --- |
lhc_dirclass | amplifyreach.com | --- | 52 years | --- |
Name | Domain | Purpose | Expiry | Type |
---|---|---|---|---|
_fbp | www.voxco.com | Facebook Pixel advertising first-party cookie | 3 months | HTTP |
__hstc | www.voxco.com | Hubspot marketing platform cookie. | 1 year | HTTP |
__hssrc | www.voxco.com | Hubspot marketing platform cookie. | 52 years | HTTP |
__hssc | www.voxco.com | Hubspot marketing platform cookie. | Session | HTTP |
Name | Domain | Purpose | Expiry | Type |
---|---|---|---|---|
_gid | www.voxco.com | Google Universal Analytics short-time unique user tracking identifier. | 1 days | HTTP |
MUID | bing.com | Microsoft User Identifier tracking cookie used by Bing Ads. | 1 year | HTTP |
MR | bat.bing.com | Microsoft User Identifier tracking cookie used by Bing Ads. | 7 days | HTTP |
IDE | doubleclick.net | Google advertising cookie used for user tracking and ad targeting purposes. | 2 years | HTTP |
_vwo_uuid_v2 | www.voxco.com | Generic Visual Website Optimizer (VWO) user tracking cookie. | 1 year | HTTP |
_vis_opt_s | www.voxco.com | Generic Visual Website Optimizer (VWO) user tracking cookie that detects if the user is new or returning to a particular campaign. | 3 months | HTTP |
_vis_opt_test_cookie | www.voxco.com | A session (temporary) cookie used by Generic Visual Website Optimizer (VWO) to detect if the cookies are enabled on the browser of the user or not. | 52 years | HTTP |
_ga | www.voxco.com | Google Universal Analytics long-time unique user tracking identifier. | 2 years | HTTP |
_uetsid | www.voxco.com | Microsoft Bing Ads Universal Event Tracking (UET) tracking cookie. | 1 days | HTTP |
vuid | vimeo.com | Vimeo tracking cookie | 2 years | HTTP |
Name | Domain | Purpose | Expiry | Type |
---|---|---|---|---|
__cf_bm | hubspot.com | Generic CloudFlare functional cookie. | Session | HTTP |
Name | Domain | Purpose | Expiry | Type |
---|---|---|---|---|
_gcl_au | www.voxco.com | --- | 3 months | --- |
_gat_gtag_UA_3262734_1 | www.voxco.com | --- | Session | --- |
_clck | www.voxco.com | --- | 1 year | --- |
_ga_HNFQQ528PZ | www.voxco.com | --- | 2 years | --- |
_clsk | www.voxco.com | --- | 1 days | --- |
visitor_id18452 | pardot.com | --- | 10 years | --- |
visitor_id18452-hash | pardot.com | --- | 10 years | --- |
lpv18452 | pi.pardot.com | --- | Session | --- |
lhc_per | www.voxco.com | --- | 6 months | --- |
_uetvid | www.voxco.com | --- | 1 year | --- |