Sample Size Calculator Thurstone scale

Survey Features

Sample Size Calculator

Get your current survey solution evaluated by our experts.

How many respondents should you have for a successful survey? 

Determining the sample size of your survey can be exhausting. But a representative sample size is crucial in generating statistically significant data. 

So how do you calculate the sample size? By hand or by using a sample size calculator.

Here, we have explained all about selecting the right number of respondents to create an accurate sample size.

What is the sample size in surveys?

The number of completed responses in your survey is known as the sample size. Because it merely reflects a portion of the group of people (or target population) whose ideas or behavior you care about, it’s termed a sample. For example, a “random sample” is a method of sampling in which respondents are picked purely by chance from the general population. 

Sample size in research is the number of people included in the study to reflect a population. The size represents the overall number of respondents present in the study. 

This number is often split into sub-groups based on demographics such as age, gender, and location to ensure that the total sample accurately represents the entire population. Determining the optimum size is one of the most important aspects of statistical analysis. The results will not be valid if very small sample size is selected.

The size can be calculated by hand using the formula we mention next or by using a sample size calculator.

Find your target audience & elevate your research!

Create a high-quality sample with access to more than 10Mn respondents.

How to calculate the sample size?

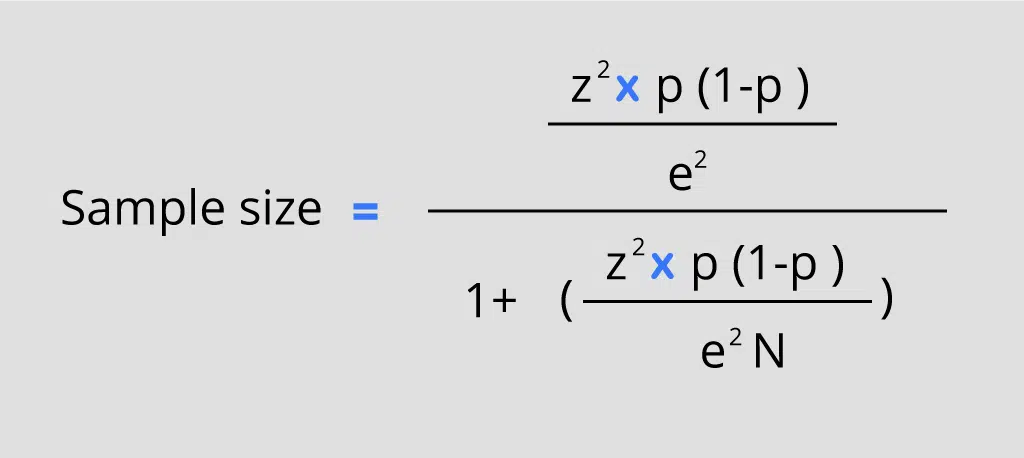
You can use the following formula to detemine the correct sample size your research should have. 

Sample Size Calculator Thurstone scale

OR

Sample Size Calculator Thurstone scale

N is the number of people in the population.  

z = z-score, i.e., desired confidence level

e = margin of error (% in decimal form)

The number of standard deviations a proportion is distant from the mean is represented by the z-score. Refer to the chart below to determine which z-score to use: 

Example: If you want to use a 95 percent confidence level, standard deviation of 0.5, and confidence interval (margin of error) of 5%, you can simply change the values in the formula:

e = ((1.96)2 x .5(.5)) / (.05)2 

e = (3.8416 x .25) / .0025 

e = .9604 / .0025 

e = 384.16 

Your sample size should be 385. 

You can leverage a sample size calculator to evaluate the efficacy of your survey sample. The calculator can help you mitigate human error and calculate the size faster. 

Before you start calculating the right size of respondents, you should learn more about certain nuances. 

  1. Margin of Error or Confidence Interval
  2. Confidence Level
  3. Population Size
  4. Standard Deviation

Let’s discuss these three factors in brief. 

1. Margin of Error or Confidence interval: 

Margin of error indicates how certain you may be that the findings of a study match what you would expect to discover if the whole population being investigated could be surveyed. 

Usually, the confidence interval is expressed as a plus or minus number. 

If your confidence interval is 7 and 70% of your sample chooses a response, you can be certain that if you surveyed the entire population, 63 percent (70-7) and 77 percent (70+7) would choose that response. 

2. Confidence level: 

The percentage will tell you how confident you can be that the real population taking your survey will choose an answer from the available options. 

It’s expressed as a percentage and indicates how often the percentage of people who would choose a particular response falls inside the confidence interval. 

For example, a 99 percent confidence level suggests that if you repeat a poll repeatedly, your results will match those of a population 99 percent of the time. 

3. Population Size:

Population size is the total number of audience you want to gather data on, the total no. of people you want to survey. 

For example, if you want to gather data from Japanese residing in Australia, your population size would be approx. 93.5 thousand (as of October 2021). 

4. Standard deviation: 

The standard deviation, which gauges a data set’s distribution from its mean, is another essential factor to consider when calculating sample size. 

The standard deviation can be used to estimate how much the replies you receive will differ from each other and the mean when determining the sample size. We can use a sample’s standard deviation to approximate a population’s standard deviation.

Learning about these factors that affect the statistical significance is better, especially when using a sample size calculator. This will help you uncover where the problem lies and allow you to fix it faster.

10Mn Respondents, 90+ profiling data, and more.

Uncover valuable insights from the pre-screened audience with Voxco Audience.

What’s the importance of a statistically significant sample size in the result?

The greater the sample size, the more statistically significant the survey results are likely to be.  

A larger sample size can help you reduce the margin of error. No matter how carefully you select your sample, you will likely fall victim to the margin of error. 

However, with larger sample size, you are likely to gather data that can create an accurate picture of the population and demonstrate statistical significance. 

However, in some cases, even if you don’t have a survey sample size that represents the entire population, survey sampling can still provide useful information. For example, customer feedback is one of the surveys that accomplish this, regardless of whether or not the sample size is statistically significant. 

But, political pollsters must cautiously select a sample size that reflects the entire population. They must ensure that it is balanced and representative of the entire population. 

To ensure you have a representative sample use a sample size calculator.

Let’s see some other use cases that require you to have a statistically significant sample size. 

Employee surveys 

Having a statistically significant sample size can help you get a more comprehensive picture of your personnel. It’s still vital to send the survey even if the sample size isn’t statistically significant. 

Customer satisfaction surveys 

Customer satisfaction surveys do not always require a statistically significant sample size. While your responses must be correct and reflect client sentiment, you should truly scrutinize each response in a customer satisfaction survey.

Market research 

A statistically significant sample size can quickly assist you in gaining insight into your whole target market. It also ensures that you’re receiving the most up-to-date data.

Determine your sample size

It is neither ideal to assume a lot of people will participate nor to guess the number of people who will participate. Using a sample size calculator to determine a statistically significant sample size is a good business for any research method. 

You can also use a survey panel such as Voxco Audience to select qualified and vetted participants. This makes it easier to create a statistically significant sample size and gather feedback from around the world. 

Now that you have learned how to select an accurate sample, all you need to do is conduct your market research.

Related Features

Sample Size Calculator Thurstone scale

Concept Testing

Concept Testing SHARE THE ARTICLE ON Table of Contents You may have many ideas for new products. Or, maybe you want to update the products

Read More »
Voxco is trusted by Top 50 Market Research firms, Global Brands & Universities in 40 countries. Voxco offers full omnichannel capability including CATI, Predictive Dialler, Online surveys, offline CAPI, and Panel Management.

Follow Voxco on