


 English


How to Use Customer Journey Maps as a Tool to Enhance Customer Experience (CX)
How to Use Customer Journey Maps as a Tool to Enhance Customer Experience (CX) SHARE THE ARTICLE ON Table of Contents What is a Customer
Find the best survey software for you!
(Along with a checklist to compare platforms)
Take a peek at our powerful survey features to design surveys that scale discoveries.
Explore Voxco
Need to map Voxco’s features & offerings? We can help!
Find the best customer experience platform
Uncover customer pain points, analyze feedback and run successful CX programs with the best CX platform for your team.

We’ve been avid users of the Voxco platform now for over 20 years. It gives us the flexibility to routinely enhance our survey toolkit and provides our clients with a more robust dataset and story to tell their clients.
Steve Male
VP Innovation & Strategic Partnerships, The Logit Group
Explore Regional Offices
Find the best survey software for you!
(Along with a checklist to compare platforms)
Take a peek at our powerful survey features to design surveys that scale discoveries.
Explore Voxco
Need to map Voxco’s features & offerings? We can help!
Find the best customer experience platform
Uncover customer pain points, analyze feedback and run successful CX programs with the best CX platform for your team.
We’ve been avid users of the Voxco platform now for over 20 years. It gives us the flexibility to routinely enhance our survey toolkit and provides our clients with a more robust dataset and story to tell their clients.
Steve Male
VP Innovation & Strategic Partnerships, The Logit Group
Explore Regional Offices
01

A data analysis plan can be defined as a roadmap that outlines how you will go about analyzing survey data in the most effective way. This plan should help answer your top research questions that were outlined before the research was conducted.
See what our clients say about Voxco
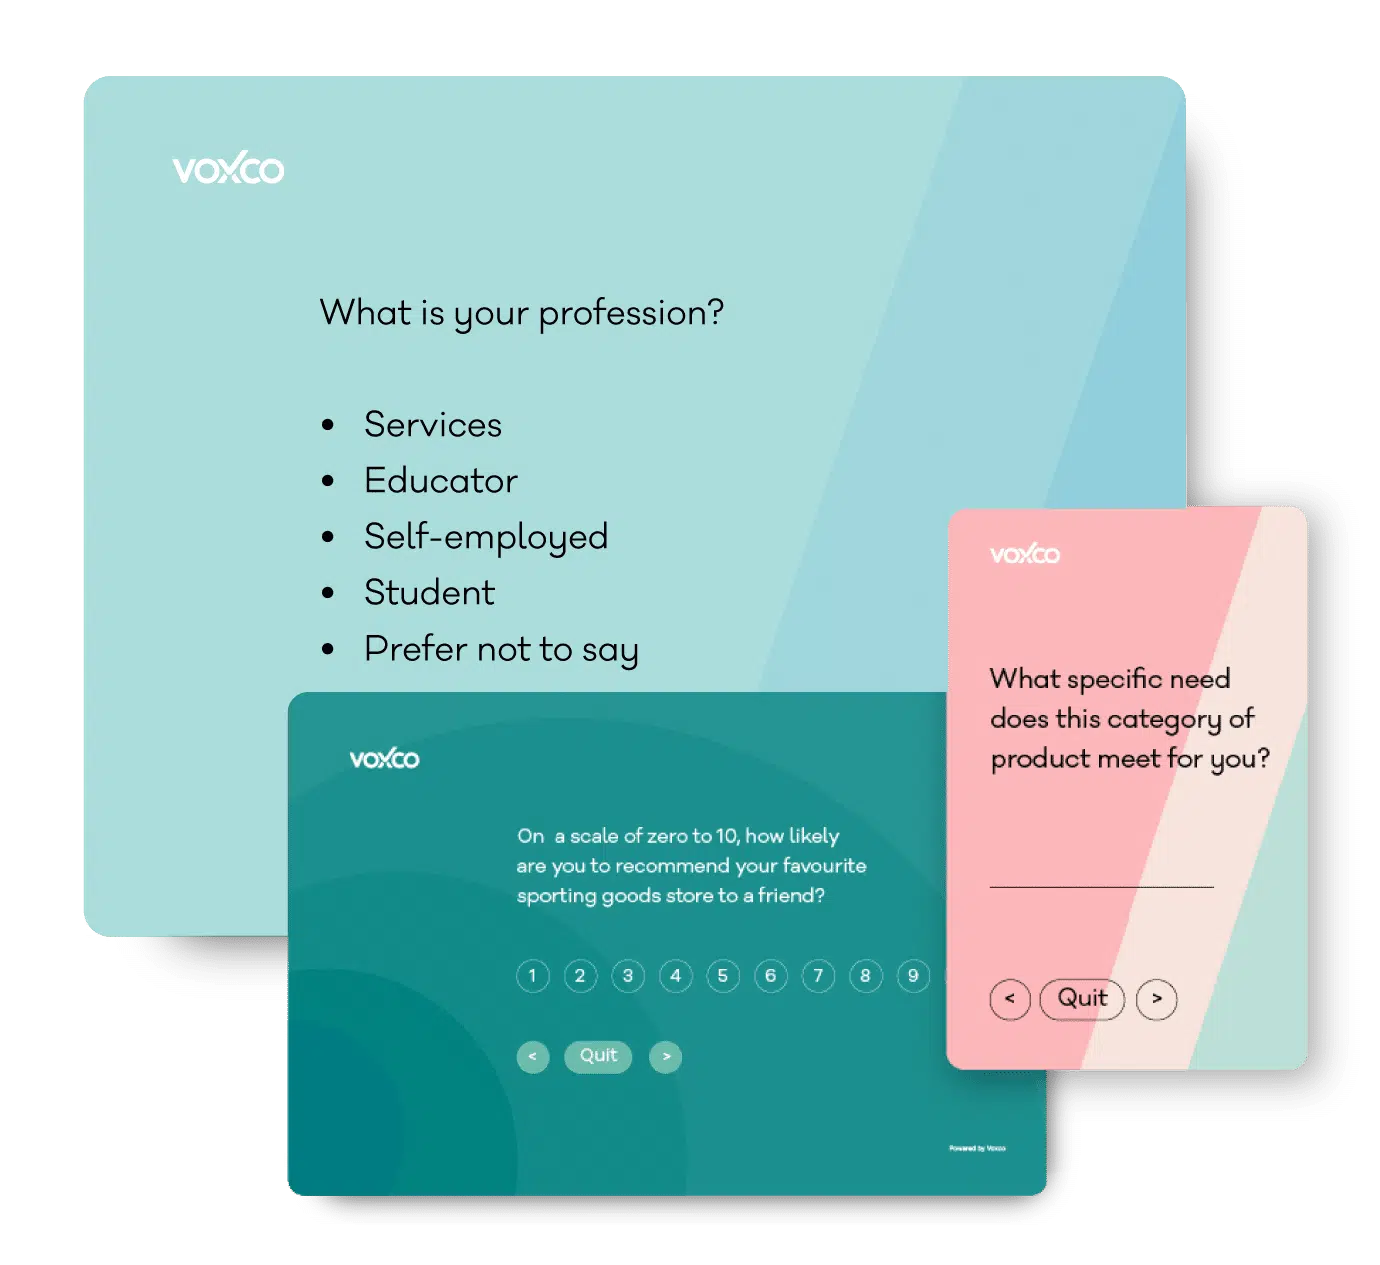
See what question types are possible with a sample survey!
02
These are a few tips that can be followed in order to create an effective data analysis plan:
By going back to the goals and research questions that you had initially outlined, you can refocus on the objectives of your study. This will allow you to plan how you’re going to organize survey data while keeping these goals and research questions in mind.
Data analysis plans usually begin with the analysis of responses to the primary research questions within the survey. Responses to these questions are the foundation of your topline results.
In order to extract an insightful understanding of your survey data, you must organize survey questions by attributing each one to your research question. This helps categorize responses and can outline which data you require to answer the main questions of the survey.
An important part of identifying the significance of the data collected is identifying different demographic groups by segmenting survey respondents. In order to do this, demographic questions must be included in your survey. These questions must extract information on variables such as age, gender, institution, and more.
By understanding the ways in which different demographic groups respond differently to your survey, you can gain perspective that will help you turn data into actionable insights.
It is important to be sure that your respondents are representative of your target population. If random sampling, for instance, was used to select a sample group, a more arbitrary group of individuals are responding to your survey. It is important to understand the statistical significance of the data collected, as a low statistical significance will have a higher probability of error, giving you unreliable results.
Every aspect of the data must be analyzed before making assumptions, as certain correlations found within the data may not have a causal relationship. You want to avoid drawing any inaccurate conclusions; hence, you must analyze any correlation before expressing a relationship between the variables.
Comparing your survey results with data collected in the past will give you an idea of trends and can help you understand whether your company is doing better or worse over time. If this is your first time collecting data, make sure you use these results as a benchmark for your next data analysis.
03

These are a few ways in which your survey results can be presented:
Learn how to meet respondents where they are, drive survey completion while offering a seamless experience, Every Time!
04
These are a few ways in which Voxco can enhance your data analysis process:
Voxco’s dynamic dashboards and analytics create real-time visual data stories with just a single click.
Voxco’s survey software allows you to create your survey once and deploy it across all of your channels. This saves time as it eliminates the need for reprogramming questionnaires.
Voxco’s survey software is a global leader in cloud and on-premise omnichannel survey software. Our integrated survey platform allows you to obtain survey data through various channels, including offline, mobile, web, and phone surveys.
Voxco’s data collection modes are also supported by additional tools such as Panel Manager, Voxco Analytics, and Dashboard. With Voxco, you also have access to a skilled and experienced services team that can help cover all your needs.
Switch to Voxco Telephony System to improve your Call Center Productivity by 400% or more
Powerful phone survey software with advanced telephony features for contact centers of call centers of all sizes
Automated interactive voice response survey software with auto call detector, advanced call routing system & manual TCPA compliance.
Power, Predictive, Preview, and Hybrid modes. Tailor your dialing method to each project.
Survey organizations around the world have maximized their phone survey ROI with the advanced features, hosting options, seamless telephony integration, and flexible pricing of our CATI software.
Read more
How to Use Customer Journey Maps as a Tool to Enhance Customer Experience (CX) SHARE THE ARTICLE ON Table of Contents What is a Customer

Here’s what you need to know about KnowledgePanel Surveys SHARE THE ARTICLE ON Table of Contents What is Knowledge Panel? Knowledge Panel is known as
Numerical data: Types and Characteristics Improve decision-making by gathering customer data. Get Started Today SHARE THE ARTICLE ON Table of Contents Numerical data helps you

15 Questions to use in your NPS® Survey Template Maximize NPS® Insights Unlock insights that drive growth and improve customer engagement Download Free NPS Guide

Logistic Regression SHARE THE ARTICLE ON Table of Contents Logistic regression is one of the types of Regression Analysis. Regression analysis is a statistical approach

Using AI For Verbatim Analysis SHARE THE ARTICLE ON Table of Contents Do you benefit from using AI for verbatim analysis? Most of the valuable
We use cookies in our website to give you the best browsing experience and to tailor advertising. By continuing to use our website, you give us consent to the use of cookies. Read More
| Name | Domain | Purpose | Expiry | Type |
|---|---|---|---|---|
| hubspotutk | www.voxco.com | HubSpot functional cookie. | 1 year | HTTP |
| lhc_dir_locale | amplifyreach.com | --- | 52 years | --- |
| lhc_dirclass | amplifyreach.com | --- | 52 years | --- |
| Name | Domain | Purpose | Expiry | Type |
|---|---|---|---|---|
| _fbp | www.voxco.com | Facebook Pixel advertising first-party cookie | 3 months | HTTP |
| __hstc | www.voxco.com | Hubspot marketing platform cookie. | 1 year | HTTP |
| __hssrc | www.voxco.com | Hubspot marketing platform cookie. | 52 years | HTTP |
| __hssc | www.voxco.com | Hubspot marketing platform cookie. | Session | HTTP |
| Name | Domain | Purpose | Expiry | Type |
|---|---|---|---|---|
| _gid | www.voxco.com | Google Universal Analytics short-time unique user tracking identifier. | 1 days | HTTP |
| MUID | bing.com | Microsoft User Identifier tracking cookie used by Bing Ads. | 1 year | HTTP |
| MR | bat.bing.com | Microsoft User Identifier tracking cookie used by Bing Ads. | 7 days | HTTP |
| IDE | doubleclick.net | Google advertising cookie used for user tracking and ad targeting purposes. | 2 years | HTTP |
| _vwo_uuid_v2 | www.voxco.com | Generic Visual Website Optimizer (VWO) user tracking cookie. | 1 year | HTTP |
| _vis_opt_s | www.voxco.com | Generic Visual Website Optimizer (VWO) user tracking cookie that detects if the user is new or returning to a particular campaign. | 3 months | HTTP |
| _vis_opt_test_cookie | www.voxco.com | A session (temporary) cookie used by Generic Visual Website Optimizer (VWO) to detect if the cookies are enabled on the browser of the user or not. | 52 years | HTTP |
| _ga | www.voxco.com | Google Universal Analytics long-time unique user tracking identifier. | 2 years | HTTP |
| _uetsid | www.voxco.com | Microsoft Bing Ads Universal Event Tracking (UET) tracking cookie. | 1 days | HTTP |
| vuid | vimeo.com | Vimeo tracking cookie | 2 years | HTTP |
| Name | Domain | Purpose | Expiry | Type |
|---|---|---|---|---|
| __cf_bm | hubspot.com | Generic CloudFlare functional cookie. | Session | HTTP |
| Name | Domain | Purpose | Expiry | Type |
|---|---|---|---|---|
| _gcl_au | www.voxco.com | --- | 3 months | --- |
| _gat_gtag_UA_3262734_1 | www.voxco.com | --- | Session | --- |
| _clck | www.voxco.com | --- | 1 year | --- |
| _ga_HNFQQ528PZ | www.voxco.com | --- | 2 years | --- |
| _clsk | www.voxco.com | --- | 1 days | --- |
| visitor_id18452 | pardot.com | --- | 10 years | --- |
| visitor_id18452-hash | pardot.com | --- | 10 years | --- |
| lpv18452 | pi.pardot.com | --- | Session | --- |
| lhc_per | www.voxco.com | --- | 6 months | --- |
| _uetvid | www.voxco.com | --- | 1 year | --- |