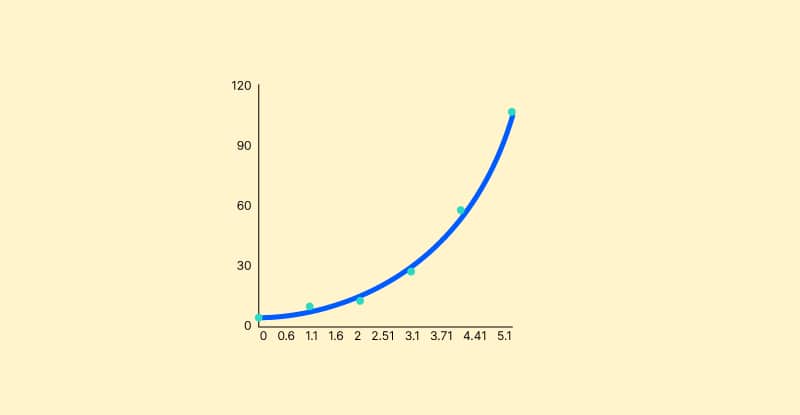
Dot Plot

SHARE THE ARTICLE ON

Dot Plot Dot Plot
Table of Contents

A dot chart, also known as a dot plot, is a type of statistical chart that consists of data points shown on a relatively basic scale, generally utilizing filled in circles. The dot chart is available in two popular, but quite distinct, variations. The first has been used to show distributions in hand-drawn (pre-computer age) graphs dating back to 1884. William S. Cleveland describes the other version as an alternative to the bar chart in which dots are used to indicate quantitative values (e.g. counts) connected with categorical variables.

The most well-known dot plot is perhaps the Federal Reserve’s quarterly interest rate predictions.

What Is A Dot Plot?

A dot plot visually arranges the number of data points in a data collection according to their values. This provides a visual representation of the data distribution, akin to a histogram or probability distribution function. Dot plots enable for a rapid visual study of data to discover the data’s central tendency, dispersion, skewness, and modality.

Dot plots are usually set up with one axis displaying the range of values or categories along which the data points are categorized and a second axis displaying the number of data points in each category. Dots can be stacked vertically or horizontally to display how many dots are in each group for simple visual comparison.

This is similar to a line graph. The primary distinction is that dots on a dot plot are not linked by a line. Line graphs, on the other hand, link the dots with a line. Like a dot plot, a line graph has an x-axis and a y-axis.

Exploratory Research Guide

Conducting exploratory research seems tricky but an effective guide can help.

History

A similarity matrix, often known as a dot plot, is one approach to show the similarity between two protein or nucleic acid sequences. These are two-dimensional matrices that compare protein sequences along the vertical and horizontal axes, first described by Gibbs and McIntyre in 1970. Individual cells in the matrix can be colored black if the residues are same, such that matching sequence segments show as runs of diagonal lines across the matrix for a simple visual depiction of the similarity between two sequences.

Constructing A Dot Plot

Data points are piled in a column over a category while creating a dot diagram. The frequency of observation in a specific category is represented by the height of the column. The numbers 0 to 9 are the categories of the dot diagram, where 0 happens three times, 1 occurs seven times, 2 occurs seven times, 3 and 4 occur six times, 6 occurs four times, 7 and 9 occur nine times, and 8 occurs twice.

The dot diagram above depicts the total amount of data points and how they are divided across several categories.

Uses Of Dot Plot

Bioinformatics:

Gibbs and Mclntyre invented the dot plot in 1970 to visualize the similarity of two nucleic acid sequences (protein). Typically, proteins are compared along the x and y axes.

We know from our mathematical science knowledge of graphs that identical proteins will form a diagonal from the dots. As a result, the remnants or lone dots are colored to facilitate identification.

Monetary Institution

At a number of Federal Open Market Committee meetings, the United States Federal Reserve (Fed) employs dot plots to transmit interest-rate projections on Federal Funds. This committee’s members draw dots on the dot graph to represent their future interest rate estimates.

Research

Dot plots are used in research to investigate the similarities between one or more variables. The conclusions drawn from data analysis using dot plots can aid in the prediction of trends and the provision of appropriate remedies.

Analyzing Dot Plot

A dot plot or dot diagram is made up of a horizontal scale (a number line) with dots organized to indicate the numerical values of a data collection. If the values in a data set recur, the dots at that position are gathered. For each repeat, one dot is plotted. Dot diagrams are used to show data dispersion.

In compared to a big list of numbers, analyzing the dot plot of a particular data set is simple. The dot plot figure below shows that the dots are uniformly spaced, with a peak at roughly 8 letters. The graph’s center is between 6 and 7 letters. The dots range from 3 to 9 letters.

You can quickly count the number of times each category or number is repeated using a dot plot. A dot plot is the best technique to organize numbers and values.

Interpretating A Dot Plot

  • Each dot in a dot graph indicates a defined number of observations from a given collection of data (unless otherwise stated, each dot represents one observation). If a dot represents more than one observation, the number of observations should be noted on the plot.
  • The dots are placed in a column over the category, with the column height representing the absolute or relative frequency of observation in the category.
  • Only when the categories are quantitative can the pattern of data created in a dot plot be accurately articulated in terms of symmetry and skewness; when the categories are qualitative, a dot plot is insufficient to define those concepts.
  • Dot plots, in compared to other types of graphs, are frequently used to represent frequency counts within a small number of categories, and therefore a small collection of data.

For A Distribution That Is Symmetric

As a depiction of a distribution, a dot plot consists of a set of data points drawn on a basic scale. For continuous, quantitative, univariate data, dot charts are utilized. If there are few data points, they can be labelled.

Dot plots are one of the most basic statistical plots, and they work well with small to medium-sized data sets. They are useful for identifying clusters, gaps, and outliers. Another benefit is the preservation of numerical information. When working with bigger data sets (about 20–30 or more data points), a stemplot, box plot, or histogram may be more effective, as dot plots may become excessively crowded at this point.Dot plots differ from histograms in that the dots are not evenly spaced along the horizontal axis.

Although the graphic looks to be straightforward, neither its calculation nor the statistical theory that underpins it are. The procedure for creating a dot plot is closely connected to the approach for estimating kernel density. The size of the dots has an effect on the look of the plot. The selection of dot size is analogous to the selection of bandwidth for a kernel density estimate.

This sort of layout is also known as a stripchart or stripplot in the R programming language.

Types Of Dot Plot

The Cleveland and Wilkinson dot plots are the most common forms of dot plots. Both use dots, but there are significant distinctions, with Cleveland resembling a bar graph and Wilkinson like a histogram.

Cleveland Dot Plot

This is a “scatterplot-like” graph created by William Cleveland that displays data points vertically in one dimension. Because of its vertical one-dimensional representation, it is sometimes compared to a histogram.

The distinction is that, unlike a histogram, which uses length to encode data values, a Cleveland dot plot utilizes position to encode data values. As a result, when plotting a dot plot, you don’t have to start the data axis at the origin, and it’s adaptable for overlaying several variables.

Despite being easily similar to a bar chart, Cleveland remarked in 1985 that “dot plots are better thought of as horizontal, one-dimensional scatterplots where tied values are disrupted or shown vertically” instead of histograms. He further divided graph estimation into three parts: discrimination, ranking and rationing.

See Voxco survey software in action with a Free demo.

See Voxco survey software in action with a Free demo.

Wilkinson Dot Plot

It is named after Leland Wilkinson and distinguishes itself by utilizing a perpendicular to the scale local displacement to prevent the dots from overlapping. He was an Adjunct Professor of Statistics at Northwestern University in Evanston at the time he published this dot plot technique.

Despite the fact that other dot plot versions have been produced in the past, Wilkinson’s research concentrated on introducing a new algorithm for making dot plots on a computer. He said in this study that existing programs do not accurately recreate dot plots.

Instead, they employed regular class intervals to generate charts resembling old-school line printer asterisk histograms.

Cleveland and Wilkinson also collaborated on the book The Grammar of Graphics. This book had an impact on the development of Graph Builder.

Fomc Dot Plot

Dot plots are well recognized as the approach used by the Fed to communicate its benchmark federal funds interest rate forecast at Federal Open Market Committee (FOMC) meetings. Members of the FOMC place dots on the dot plot to represent their estimates for future interest rates in succeeding years and over the long term.

Typically, the FOMC’s overall projection for interest rates in any given year is provided as the median of the dots on the dot plot. For example, the median for 2020 for the FOMC chart in the next section (Real-World Example of a Dot Plot) is about 0.1 percent, and the median for 2020 is similarly around 0.1 percent. In the meantime, the longer-run median is 2.5 percent.

Investors and economists eagerly monitor the Fed’s dot plot estimates for clues about the future path of interest rates. Each dot on the chart reflects a member’s prediction of where the federal funds rate should be at the conclusion of the different calendar years depicted, as well as in the “longer run” (the peak for the federal funds rate after the Fed has finished tightening or “normalizing” policy from its current levels).

Special Consideration (For Fomc Chart)

When looking at the FOMC chart, keep in mind that each dot indicates a member’s opinion on where rates should be at the moment. Their dot is located in the middle of the range. In other words, the dots should not be interpreted as indicating that a member is aiming towards a certain number. Notably, it is unknown which dot corresponds to which FOMC member.

It’s also crucial to remember that the Fed is mostly data-driven, which means that it continuously alters its forecasts and rates in response to economic trends and world events. In the case of a big incident, such as a terrorist attack, a severe economic slump, or a rapid increase in inflation, the most recent dot chart may no longer accurately reflect members’ forecasts.

As a result, the dot plot’s longer-term estimates have less weight than those closer to the present. Changes in Fed leadership—terms expiring, persons resigning, and others stepping up to replace vacant positions—increase the possibility of long-term policy adjustments.

Advantages Of Dot Plot

  • They are a good technique to express frequencies and proportions.
  • They are more detailed since they display data point density distribution and outliers.
  • You may increase the data density in dot plots by varying the od color and size, resulting in what we call bubble dots.
  • By adding colored dots, they may be utilized to tell a lovely tale.
  • They are capable of representing up to a thousand data points. Although it becomes messy and unsightly as the number goes greater, there is a workaround.

Disadvantages Of Dot Plot

  • When dealing with a huge data collection, it might be time-consuming to design.
  • It is frequently difficult to determine the frequency of a dataset from a dot plot. When dealing with a high frequency, the data will have to be tallied one by one, which may be impossible.
  • Large datasets are not recommended since the points become congested and difficult to read.
Online survey tools 10 1

See why 450+ clients trust Voxco!

[fluentform id="10"]

By providing this information, you agree that we may process your personal data in accordance with our Privacy Policy.

Read more