

The Voxco Answers Anything Blog
Read on for more in-depth content on the topics that matter and shape the world of research.


Market Research 101
What Is Field Research? Methods, Advantages, and Challenges
Field research is a qualitative research method used to observe and analyze subjects in their natural environment. Rather than relying on controlled experiments or lab settings, field research aims to capture real-world behavior, context, and interactions — helping researchers understand how people or organizations function in everyday settings.
Whether you're studying individuals, groups, or social dynamics, field research allows for direct, in-context observations that provide deep and nuanced insights.
Why Conduct Field Research?
Field research helps uncover information that’s difficult — or impossible — to access through traditional methods like surveys or experiments. It allows researchers to:
- Study behavior as it naturally occurs
- Understand the social or cultural context influencing that behavior
- Explore new areas of inquiry when existing data is limited or unavailable
It’s especially useful when:
- The subject matter is complex or sensitive
- The setting plays a key role in influencing behavior
- Researchers need rich, exploratory insights rather than large-scale validation
With the right tools — like field service management software or offline survey apps — field research can be more streamlined, organized, and scalable.
Common Methods of Field Research
There are five widely used methods in field research. Each offers a different way to collect and interpret data based on your goals.
1. Qualitative Interviews
This involves one-on-one conversations with participants, using open-ended questions that encourage them to share their thoughts in their own words.
Best for understanding perspectives, motivations, and personal experiences.
2. Direct Observation
Researchers observe subjects in their natural environment without interacting with them or influencing the setting.
Best for capturing real-time behavior with minimal interference.
3. Participant Observation
Here, the researcher becomes part of the environment — participating in the activities being studied while observing them from within.
Best for immersive studies where trust and insider perspectives matter.
4. Ethnography
Ethnographic research is an in-depth exploration of a group or culture, focusing on how individuals interact within their social setting. It often involves extended observation over time.
Best for understanding social norms, community dynamics, and cultural influences.
5. Case Studies
A case study involves a deep dive into a particular event, individual, group, or organization in its real-life context.
Best for exploring complex phenomena in detail, especially when generalization isn't the goal.
Advantages of Field Research
- High External Validity: Since data is collected in natural environments, results are often more generalizable to real-world situations.
- Rich, Contextual Data: Field research produces detailed, in-depth data that goes beyond what can be gathered through structured surveys.
- Social Context and Discovery: It reveals unspoken social dynamics or behaviors that participants may not consciously recognize or report.
- Empirical Grounding for Hypotheses: It offers real-world grounding to test early hypotheses or shape future research studies.
Disadvantages of Field Research
- Time-Intensive: Field research often takes longer to plan, execute, and analyze compared to other methods.
- Costly: Travel, staffing, equipment, and logistics can make it significantly more expensive than in-lab research or surveys.
- Risk of Researcher Bias: Immersive methods like participant observation can make it difficult for researchers to remain objective.
- Limited Sample Sizes: Field studies typically involve smaller samples, making statistical generalization more difficult.
Field Research vs Other Qualitative Methods
While interviews and surveys are often conducted in controlled or remote settings, field research stands out by placing the researcher directly within the subject’s environment. It’s not just about collecting opinions — it’s about observing behavior, routines, and social dynamics as they unfold.
Field research complements other methods by offering context, nuance, and firsthand understanding.
Final Thoughts
Field research is one of the most powerful tools for capturing how people behave and interact in real-world settings. It offers insight that goes far beyond what can be measured in a lab or captured in a survey. But it also requires more time, resources, and planning than other methods.
By choosing the right field research method and using modern tools to support your work, you can gain a deeper understanding of your audience, community, or social environment — and apply those insights to make more informed, impactful decisions.
Read more
%20(2).webp)
How to Choose the Right Solution
The 2026 CATI Landscape: Who Is Still Standing?
A few years ago, a “Top 15 CATI Software” list felt realistic. That’s not the case in 2026.
The CATI market has consolidated fast. Many familiar names still exist, but as parts of much larger platforms, often inside broader CX, patient experience, or contact-center ecosystems. In those environments, CATI may remain available, but it’s less often the primary product focus.
At the same time, CATI hasn’t disappeared. It’s still essential for research teams that need structured interviewing, complex logic, quality control, and tight fieldwork management. What’s changed is how many providers still build for that reality.
This updated guide focuses on the platforms that are still actively standing in the CATI landscape today, either as large “suite” providers with CATI as one part of a broader ecosystem, or as research-first platforms where CATI remains a core capability.
1. Voxco
The Status
Voxco is a research-first platform where CATI remains a core capability, designed to support both small and large-scale telephone operations, and to run CATI within a broader mixed-mode workflow when needed.
The Strength
- Built for complex CATI fieldwork: advanced questionnaire logic, validations, and multilingual support (including updating questionnaires in real time without interrupting fieldwork)
Voxco CATI Feature Sheet EN - Strong sample + quota control: centralized sample and quota management, including complex quota structures and weighted quota management
Voxco CATI Feature Sheet EN - Dialing built for research workflows: integrated dialing modes (preview, power, predictive, hybrid) and research-specific dialer tooling
Voxco CATI Feature Sheet EN - Quality oversight and coaching tools: call monitoring/recording plus real-time supervisor coaching features like whisper and barge-in, supported by live dashboards
Voxco CATI Feature Sheet EN - Flexible operations: supports cloud and on-premise deployments, including distributed and multi-site interviewing teams
Voxco CATI Feature Sheet EN
Why It’s Still Standing
In a market where many tools have been absorbed into broader suites, Voxco remains positioned around fieldwork rigor, keeping CATI as a primary capability rather than a legacy module.
2. Qualtrics (Press Ganey Forsta)
The Status:
In October 2025, Qualtrics announced a definitive agreement to acquire Press Ganey Forsta for $6.75B, positioning it as a major move to advance AI-powered experience management.
Forsta itself was formed by the merger/rebrand of major experience and research technology brands (including Confirmit and FocusVision).
The Weakness
- CATI becomes one signal among many: In large “experience management” ecosystems, CATI tends to shift from being a core engine of research operations to being one input among broader VoC/EX/PX measurement programs.
- Product direction can become harder to read: When research technology is integrated into a broader suite, teams that rely on deep CATI-specific workflows may need to watch roadmap priorities closely (especially during integration phases).
2. Enghouse Insights
(Formerly Survox / Nebu)
The Status
The Survox and Nebu brands, both historically well known in CATI and research operations, have been formally retired and absorbed into Enghouse Insights, part of the broader Enghouse Systems portfolio.
The Weakness
Enghouse is first and foremost a generalist contact center technology provider. Its core focus is customer service operations, agent efficiency, and omnichannel contact handling across industries.
As CATI capabilities are folded into this broader contact-center stack, the specialized research functionality that originally differentiated Survox and Nebu, such as research-first sample management, quota logic, and fieldwork controls, becomes less central. For research teams, CATI increasingly risks being treated as a call-flow problem rather than a data-collection methodology.
3. NIPO – Nfield
The Status
NIPO has largely transitioned away from its legacy on-premise CATI systems in favor of Nfield, its cloud-native data collection platform. Nfield now represents the center of gravity for NIPO’s product strategy.
The Weakness
Nfield is well suited for cloud-first research teams, particularly in European markets. However, its SaaS-only deployment model can introduce limitations for organizations that require greater flexibility.
For large, multi-site CATI operations—especially in North America or global enterprise contexts—cloud-only architectures may struggle to meet scale, latency, or infrastructure expectations. In regulated environments, the inability to control where data is physically stored or processed can also be a barrier.
4. QuestionPro
The Status
QuestionPro has grown into a large “DIY-to-Enterprise” survey platform by offering a very broad feature set across online surveys, panels, experience measurement, and analytics. Its strength lies in flexibility and accessibility across many use cases.
The Weakness
Because QuestionPro aims to serve a wide range of survey needs, its CATI functionality is positioned more as an extension of online surveying than as a purpose-built telephone interviewing system. In practice, this means CATI workflows tend to resemble a web survey with a dialer layered on top.
For research teams running serious telephone fieldwork, this can translate into limitations around industrial-grade sample management (such as recycling phone lists) dynamically weighting quotas, and cleaning sample in real time as field conditions change.
The Hard Truth: Why CATI Needs Are Decreasing
CATI usage is often described as declining simply because “online surveys are cheaper.” In 2026, that explanation only scratches the surface. The more significant pressures on CATI are technical and structural.
- Carrier-Level AI Blocking
Modern smartphones now apply AI-driven spam and call screening at the operating-system level. Research calls are increasingly flagged, or blocked entirely, before the phone ever rings, reducing reach rates regardless of dialing strategy.
- The Decline of Geographic Sampling
Mobile phone numbers no longer reliably map to physical location. Area codes have lost their geographic meaning, making traditional location-based sampling far less effective for local government, regional polling, or community-level studies.
- The Rise of Synthetic Respondents
Some organizations are experimenting with AI-generated or AI-augmented respondents to reduce cost and speed up insight generation. While these approaches can be efficient, they introduce the risk of data drift, where responses begin to reflect model assumptions rather than real-world human behavior.
Together, these forces are reshaping how and when CATI is used. The method itself remains valuable, but it now requires more sophisticated tooling, tighter controls, and clearer decisions about when human-led telephone research is essential.
Why Voxco Is the Gold Standard in 2026
In a market shaped by consolidation and “good enough” AI-driven insight, Voxco has taken a different path. Rather than broadening into a general-purpose experience platform, it has continued to invest in CATI as a specialist discipline—with a focus on methodological rigor, fieldwork control, and data integrity.
The Verdict
For low-stakes research, such as lightweight customer feedback or quick pulse checks—many of the platforms discussed in this guide may be sufficient.
But for government agencies, high-stakes social research organizations, and global tracking programs, the direction of a platform matters. In those contexts, the ongoing integration and repositioning of large, consolidated brands can introduce uncertainty around product focus, roadmap priorities, and long-term support for CATI-specific workflows.
Voxco stands apart by continuing to treat CATI as a primary mission, not a legacy capability. For teams that depend on structured interviewing, fieldwork oversight, and defensible data quality, that focus remains a decisive advantage in and beyond 2026.
This blog has been updated for 2026 to reflect the current CATI software landscape.
Read more

How to Choose the Right Solution
Top 15 Auto Dialer Software
Over time dialers have evolved to ease the flow of work for contact centers. Traditionally, businesses had to upload contact lists for outbound campaigns. However, auto dialer software dials the number automatically which helps streamline the workflow of outbound contact centers.
What is Auto Dialer Software?
Automated dialer software makes outbound calls automatically by pulling telephone numbers from a list of contacts. The dialer then connects the recipient with a live agent or a pre-recorded message.
Auto dialers eliminate the need to manually dial each phone number from the list. This spares the contact center agent to focus on other tasks and on the content of the message. A wide variety of industries make use of auto dialer software such as – sales & marketing, health care, hospitality, and education.
What are the important Auto Dialer functionalities?
Auto dialers often require hardware such as a computer, active telephone line, and a voice modem. Some software providers allow businesses to host hardware into their product for free or a subscription. Other providers require them to buy and host the hardware themselves.
Auto dialer software can
- integrate directly with existing CRM software of the center; or
- built into telecom services or infrastructure software of the contact center
Auto dialer software offers an array of functionalities to take the load off of the representatives. Some of these features are common such as managing lists, initiating calls, and reporting data. Some other features that you should look for when selecting Auto Dialer Software are:
Call Disposition: to track and report the result of a call
Call Recording: to assure the quality of call conversation
Answering Machine Detection: to screen and filter out calls that go to voicemails
Call Scripting: to help agents with responses for commonly asked queries
Local Caller ID: to display local ID to contacts by setting desired location and caller ID when making calls
Top 15 Auto Dialer Software
- Voxco
- Talkdesk
- Matrix
- Genesys Cloud
- Dialpad
- Five9
- RingCentral
- PhoneBurner
- ChaseData
- CallHub
- Voicent
- contactSPACE
- Nice inContact
- Nextiva
- Aircall
#1 – Voxco

With 25+ years of experience, Voxco is the leading Research Cloud software that provides Cloud-based and On-premise dialers to help you generate successful leads and provide excellent customer experience. Moreover, Voxco’s state-of-the-art telephony system can be integrated with Voxco’s CATI phone survey software.
Voxco’s Dialer assures an improvement in the productivity of your call center by 50%. Be it work-from-home or call center agents Predictive dialing adjusts the pace of your call volume to match the availability of the agents.
The software is built to handle the workload on any scale. It is TCPA compliant which enables your agents to reach customers on the telephone as well as mobile devices. You can easily integrate with the platform’s IVR to empower the callers with self-serve options.
Voxco capabilities confirm a seamless flow of work – call recording & monitoring, call detection, intelligent call routing, and a blend of inbound & outbound calls. There are more advanced features that users can enjoy and take advantage of in Voxco.
Single-system efficiency: Voxco dialer begins dialing depending on the rules set. There is no requirement for third-party dialer integration.
4-in-1 Dialer: Preview, Power, Predictive, and Hybrid dialing modes improve the quality and speed of the calls. The 4 modes of dialing also enable you to schedule the pattern of calls per project.
Quality Control: You can monitor live calls for the purpose of quality assurance. You can also record calls to review them in the future.
- DNC numbers are also immediately filtered out of the list.
- Dialer dashboard allows supervisor to monitor productivity of each agent. You can track no. of calls handled, wrap-up time, pause and more.
Advanced Telephony Features: It is a flexible outbound calling powerhouse that comes with features like call transfer, conferencing, and audio playback.
- Call blending
- Skill set routing
- Transfer and return calls
Compatible with Protocols: Voxco Dialer supports VoIP licenses and telephony cards. The dialer supports analog and IP phones. It also connects to SIP trunks or standard T1 or E1 lines.
Flexible Pricing Options: Voxco offers flexible pricing models which are based on the requirements of organizations
#2 – Talkdesk

Talkdesk offers solutions through a single platform and helps contact centers reduce customer support costs. The software empowers a contact center with its customizable and future-proof design, helping businesses to improve customer satisfaction.
The platform has an intuitive interface and offers more than 60 integrations all in one place. It provides features such as: AI, analytics, workforce engagement, customer engagement and enterprise collaboration.
Talldesk offers multiple features to help you support your agents in the best way possible:
- Talldesk uses IVR (interactive voice response), ACD (automatic call distribution), and skill-based routing to ensure that calls only get routed to the most qualified agents who can meet the customer’s needs.
- The platform empowers the agent by displaying the caller’s name, contact history, and all relevant data on the agent’s screen in real-time. This way contact centers can support their agents to deliver a personalized experience.
- The software automatically sets up a new profile when a new customer calls.
- Talldesk comes with all needed features – call monitoring, call recording, and real-time reporting.
With its value for money, the software is easy to use for the agents. It offers three packages – Professional, Professional Plus, and Enterprise.
#3 - Matrix

Matrix auto dialer is built to suit contact centers of any size. The auto dialer software integrates with tools like CRM applications, landing pages, contact lists, and affiliate sites to improve productivity. You can also integrate your business tools using the platform’s API.
Matrix also offers many features to streamline the workflow:
- The software allows you to prioritize and improve your agent’s productivity with its reminders and callback calendars personalized for individual agents.
- The real-time dashboard allows managers to track the agents and their performance. You can see which agents are on call, duration, or waiting on calls.
- The automated triggers allow you to set up triggers to inform you whenever a lead converts into a customer.
- Matrix also provides features such as internal chat, call recording, blended inbound & outbound calls, warm transfers, wrap-up time, and more.
#4 – Genesys Cloud CX Software
Genesys Cloud is designed as an all-in-one cloud contact center to ensure that your agents can serve the customers with an exceptional experience. The auto dialer software is easy-to-use and with its intuitive interface, it helps boost agent’s performance.
Genesys Cloud offers several features to prioritize customer’s experience and agent productivity;
- Voice and digital channels allow agents to contact customers on their preferred channels.
- IVR empowers callers with a self-serve option like speech recognition and touch.
- Outbound calling – predictive, power, preview and more dialing mode- assures that agents can reach more customers and generate successful leads
- It also empowers your agents with multichannel recording, workforce management, quality management, and more features.
#5 – DialpadSupport

Dialpad is a cloud-based contact center that uses AI to empower agents with real-time customer insights. The software offers integration with Salesforce, ServiceNow, Zendesk, and more to help users onboard quickly.
Dialpad uses Voice Intelligence to monitor conversation with call transcription and live customer sentiment.
Dialpad Support offers free calls to Canada and the US. There are two packages- Pro and Enterprise
See Voxco survey software in action with a Free demo.
See Voxco survey software in action with a Free demo.
#6 - Five9

Five9 is a cloud contact center software providing solutions to over 2000 businesses worldwide. The platform is powered by Practical AI which enables your agents to provide customer experience via preferred channels – phone, chat, social media, email, and more.
- The auto dialer software supports a wide variety of dialing modes- predictive, preview, progress, power dialing mode, and more.
- Five9 pulls callers' information from your CRM and displays it on the agent’s screen before and during the call to help the agent offer personalized communication.
- The platform integrates with leading CRM packages like Salesforce, NetSuite, and Oracle. It also supports a blending of inbound and outbound calls.
Pricing in Five9 depends on the number of users, seats, and features used. Moreover, you can choose an annual or a month-to-month plan.
#7 – Ring Central

RingCentral is a cloud-based communication that offers communication across multiple channels to streamline the workflow. The platform ensures that agents can provide a personalized experience to every caller.
You can integrate any CRM or other back-end system with the software’s API to receive detailed information on the caller. The platform enables automatic display of caller’s past interactions, purchase history, ticket status, and more.
- Powered by inContact it offers ACD, IVR, CTI, auto dialer, and PBX.
- It also offers advanced routing to allow customers to self-solve their issues and skill-based call routing.
- You can track agent’s performance, KPIs, and customer experience with real-time dashboards.
- Leverage its Workforce Management, and schedule each agent’s schedule according to traffic, volume, training, and vacations.
RingCentral offers four packages based on per user for every month: Essential ($19.99), Standard ($27.99), Premium ($34.99), and Ultimate ($49.99).
#8 – PhoneBurner

PhoneBurner is a cloud-based software and can be accessed from anywhere by using its VoIP dialing. You can log in from your own computer and contact customers from the connected phone.
PhoneBurner offers various features to empower remote employees:
- Power Dialer
- Lead management
- Workflow management
- Email follow-up
- Dedicated admin portal
- Real-time reports and leaderboards
PhoneBurner makes it easy for you to manage contact lists and campaigns with its integrated sales CRM. It can also integrate your own CRM with Salesforce, HubSpot, Zapier, and more. The platform also offers a wide range of features such as call recording, call transfer, voicemail drop, one-touch emails, local ID tracking, email tracking, and many more.
There are three packages, price per user and per month: Standard ($126), Professional ($152), and Premium ($169).
#9 – ChaseData

ChaseData is built to support outbound, inbound, and blended contact centers. It is a cloud-based standalone contact center with customer support and service pre-built in the software.
- ChaseData includes different dialing modes – auto, predictive, preview, and progressive dialing. It also includes ACD to ensure that calls are routed based on language preference, skill, and training of the agent.
- The software offers security settings at the management level which allows managers to track campaigns.
- The auto-dialer software catalogs digital calls on the server for at least 90 days. This enables agents to review the calls later if required. The admin also has access to all the calls.
ChaseData offers three packages per user/month: Small Business ($89), Professional ($139), and Enterprise ($169).
#10 - CallHub

CallHub offers four auto-dialing modes to match requirements for every call – Predictive, Power, Preview, and Robo Dialer. Along with contact center solutions, it also offers Voice Broadcasting software and SMS Marketing software.
CallHub offers the following features to make the most out of the auto-dialer software:
- Local Caller ID
- Schedule follow-ups at a convenient time
- Monitor and join the live call for quality assurance
- Enable DNC or modify DNC list
- Skip over answering machine
- Screen and eliminate outdated and non-existence numbers.
- Segment telephone and mobile numbers
CallHub allows you to pay as you go, the pricing starts at $0.021 per call.
# 11 – Voicent

Voicent is a cloud-based call center that comes with a built-in CRM. The auto-dialer software supports both inbound and outbound calls.
It comes with an automation feature that helps streamline the workflow and track calls, campaigns, and customers.
- The auto dialer software enables your agents to deliver pre-recorded audio messages to your contact lists.
- Agents can also leave messages on answering machines in their own voice or computer-generated voice.
- Voicent also consists of features that involve text to speech to send out personalized messages. It offers – auto, predictive, preview, and progressive dialer- for the call requirement of your agents.
Voicent presents a package that begins with $19 for unlimited calls based on per user per month pricing.
#12 – contactSPACE

The contactSPACE, a cloud-based call center, is easy to deploy that comes with three dialing modes-predictive, progressive, and preview- to make outbound calling more efficient.
It is a flexible software that contains target filtering to allow agents to sort call recipients. It also allows admins to categorize prospective customers to match the skill of the agents. With its Dashboard designer, you can monitor the agent’s performance in real-time.
contactSPACE presents four packages for its clients:
- Siler tier $105 per user/month
- Gold tier $139 per user/month
- Platinum tier $175 per user/month
- Diamond tier $239 per user/month
#13 – Nice in Contact

Nice inContact helps contact centers to maximize the quality of leads and put customers first. The cloud-based contact center displays features for inbound support requests. It helps agents to communicate with the customers using multiple channels – calls, emails, chats, social media, and more.
Nice inContact offers other features such as:
- Automatic Call Distribution
- Blended Predictive Dialing
- Call Recording
- CRM integration
- IVR
- Analytics and Reporting
- The platform also offers workforce optimization – e-learning, workforce management, and hiring.
Any information for the pricing package is not available on their website.
#14 – Nextiva

Nextiva uses Go Integrator to help connect your CRM with its software. The platform supports integration with popular CRMs such as Hubspot, Salesforce, Zendesk, etc. that helps streamline outbound calls for your contact center.
While Nextiva is not a true auto dialer software provider, you can still take advantage of effective tools to streamline your outbound calls.
Nextiva offers tools that match the capabilities of auto dialers, such as;
- Its flagship VoIP platforms allow voice & video calling, texting, faxing, and team chat, to improve performance and results.
- Click to Dial: Your reps can dial directly from the contact list uploaded in your CRM. Moreover, because of the flawless data harmonization with your CRM, your reps receive detailed information on each call they handle.
- Contact Popping: The feature displays all the relevant details of the caller by pulling it out from your CRM.
- You can easily segment lists in your CRM or you can split lists in other CRMs offered by the software to streamline outbound calls.
Nextiva’s Professional package costs depending on the number of users ranging from $21.95 to $27.95 per user every month. For contact centers using CRM like Oracle or Service Now, you should opt for the Enterprise package.
See Voxco survey software in action with a Free demo.
See Voxco survey software in action with a Free demo.
#15 – Aircall

Aircall is an easy to set up and use, cloud-based business phone for sales and customer support teams.
The auto dialer software helps reduce agent’s workload with its Power Dialer, click-to-dial, and more cloud features. With its skill-based routing, IVR, and live call monitoring capabilities it ensures that you offer an exceptional customer experience.
It also enables call centers to integrate with CRM, Helpdesk solutions, and other required applications. Moreover, the cloud-based system keeps the remote teams connected with the call center. It allows agents to work from anywhere in the world.
Read more

Market Research 101
How to Build and Manage an Online Research Panel
Great research isn’t just about data—it’s about building a direct line to the people who shape your market. Whether you're launching a new product, refining your customer experience, or exploring social trends, having access to the right group of respondents is essential. That’s where an online research panel comes in.
In this blog, we’ll walk you through what a research panel is, the benefits of using one, how to build your own, and how panel management software can help you maintain engagement over time.
What is a Research Panel?
A research panel is a pre-recruited group of individuals who have agreed to participate in surveys, interviews, or other research activities over time. These panelists are typically selected based on specific criteria such as demographics, location, or interests—ensuring they’re well-suited to answer the questions relevant to your study.
Unlike ad-hoc survey sampling, an online research panel offers consistency and speed, allowing researchers to gather reliable data more efficiently.
Why Use a Research Panel?
Building a dedicated market research panel offers several advantages:
1. Reliable, high-quality data
Panelists are pre-screened, making it easier to gather data that’s more representative and accurate.
2. Faster turnaround
Because your panel is ready to go, data collection is quicker—especially when paired with a robust online survey platform.
3. Lower costs
Panels reduce the need to repeatedly recruit new participants, lowering long-term costs and streamlining fieldwork.
4. Deeper insights
With a consistent group of respondents, you can run longitudinal studies to track changing behaviors and sentiments over time.
5. More targeted research
Panels make it easier to run niche or technical studies with audiences who understand the topic or industry.
How to Build an Online Research Panel
Building a high-performing research panel takes planning, but it’s worth the effort. Here’s a step-by-step guide:
1. Define your research goals
Start with clarity. What questions are you trying to answer? Who do you need to reach? These answers will shape your panel’s profile.
2. Recruit participants
Use a mix of channels—like email campaigns, social media ads, SMS invites, and website intercepts—to find potential panelists. Make sure your recruitment messaging is clear about what participation involves.
3. Screen and qualify
Not everyone is a fit for every study. Use a short screening survey to ensure your panelists meet the criteria for your research objectives.
4. Set up communication workflows
Whether through email or SMS, keep panelists engaged with study invites, updates, and reminders. A well-informed panel is more likely to stay active.
5. Incentivize participation
Offer rewards—such as gift cards, loyalty points, or exclusive access to results—to motivate participation. Even small gestures go a long way.
6. Conduct research
Once your panel is in place, you can start running online surveys, virtual focus groups, product tests, and more.
7. Analyze results
Use survey analytics tools to review your data, visualize trends, and identify actionable insights that align with your business goals.
How Panel Management Software Helps
Maintaining a panel is just as important as building one. That’s where panel management software comes in.
A good panel platform can help you:
- Automate recruitment and screening
- Manage ongoing communication with panelists
- Track participation history and profiling data
- Distribute surveys and collect feedback
- Provide timely incentives
- Monitor engagement and churn rates
Voxco’s panel management solution makes it easy to build, manage, and scale custom research panels—whether for brand tracking, customer feedback, or product development.
Common Uses of Research Panels
Companies and researchers use market research panels for a wide range of purposes, including:
- Testing new product concepts before launch
- Collecting feedback on brand experience
- Tracking customer sentiment over time
- Conducting competitive benchmarking
- Exploring trends in consumer behavior
Final Thoughts
Building a strong research panel takes time—but it’s a smart investment in the future of your research. With the right tools and strategy, an online panel can become your most valuable source of consistent, reliable data.
Ready to see how Voxco can help you streamline recruitment, retention, and research? Book a demo today.
Read more

Market Research 101
Internet Panel Surveys : The faster and easier way of gathering market data
The process of collecting market intelligence is a crucial one , especially when the organizations carrying it out rely on it to make informed business decisions. As a result , gathering market data in a quick and efficient manner becomes the need of the hour. Companies need to optimize their approaach to data collection in way that reduces their effort and provides them with qualitative input that assist intelligent follow-up actions.This can be easily achieved through internet panel surveys that not only provide organizations with the ability to gather quick data points within specified time frames but also recruits individuals with the right knowledge that increases the efficacy of the research process. This fast research mechanism even lets companies take advantage of opportunities that present itself in the market before the ccompetition , hence , allowing them to develop a stronger footing and cash in on growth opportunities.
Internet panels : The right respondents to your questions
Internet panels are specialized individuals who are equipped with the relevant information to answer specific research questions in the best possible manner. These people have high experience and intelligence in particular fields of organizational interest. This makes them highly eligible to provide prompt answers and deep insights that can serve as an impetus to the functioning of organizations. For example: for concept studies of products such as Kindle’s Fire tablet , the internet panel is likely to consist of low income working employees or students with a need for a tablet ,to carry out their day to day activities , within an affordable price range. Regular e-book readers and Amazon members wishing to integrate all their entertainment and work related actvities is another niche market that the product will appeal to and so , they must be consulted for authentic feedback that can be used to tailor make the product for the target audience.Internet panels allow organizations to hand pick the individuals that they'd like to carry survey for specific information. This allows the organisations to conveniently select the right people in the right number without any geographical restrictions. These answers then get combined into a cohesive overview of the topic of research through useful analytical tools that are designed to treat and summarize different types of information .
Advantages of using internet panel surveys
The benefits listed below make a good case for using internet panel surveys :
Convenience :
Internet panel surveys are meant to offer convenience with quality. Surveys are designed and distributed through multiple channels with vast audience traffic that engage high number of relevant respondents while collecting intelligence in a quick manner. Organizations are not required to put in extra resources or effort to look for eligible respondents . Information gets sourced through multiple respondents without much hassle . Internet panel surveys , in this sense , provide a great deal of insights at minimal effort.
Highly representative :
The respondents in an Internet Panel Study are highly aware about the current market trends and customer preferences . Their answers and suggestions are much more representative of the actual market sentiment. This allows organizations to extract maximum information using a sample of participants. This reduces sampling bias and makes the implementation of modifications much more easier as it helps gain ready market acceptance . Organizations need not search for specified individuals that meet the eligibility criteria as such work can be feasibly outsourced
High-quality responses :
The high expertise of the respondents in the study helps gain quality insights . By quality insights , we mean that respondents are able to answer based on up to date market information and their own experience as well as researchers get to explore additional areas without worrying about the respondent's levels of understanding. The feedback provided by such respondents is authentic and can be trusted to deliver in terms of market results.
Economical :
As American author Seth Godin puts it : Everyone is not your customer. By spending on surveying large samples of data that might or might not help , you skim through the crowd to identify respondents that are fit and eligible to answer your questions. Moreover , you get to reach these individuals not through traditional methods that make the data collection process slow and tedious , but by accessing data throughout the world without being restricted by geographical barriers. This results in increased saving and increased earnings as a result of less cost and increased revenue from products modified to meet customer expectations , designed and improved using meticulous research .
Technical research :
Business research and market studies require respondents who can answer questions regarding consumer behaviour , customer psychology , market trends and many more highly technical areas of functioning which not any person with a generalized familiarity can answer. For specific studies , there is a requirement of experts in specialized fields who have been studying brand or customer specific behaviour for long periods of time and can back up claims with hard facts and figures . Traditional methods may not be able to provide you with professionals that make your research more concentrated. The researcher can easily dive into deeper aspects and use technical jargon without running the risk of confusing the respondent.
Panel Management
You've recruited a panel of individuals best suited for a particular research topic. Is it fair to contact them only when the organization is looking for answers?Maintaining panels of respondents is all about engagement. Panelists are interested in engaging in a dialogue with the organizations they are assisting. Sometimes , this lack of engagement forces the respondents to drop out of studies even when such studies are accompanied by incentives and rewards . This is particularly true for brand related studies where respondents volunteer to take part in research to help out the brand that they love or have shared a long journey with. Naturally , these people becomes the first choice for becoming a part of the respondent panels . But the lack of interaction can turn these brand advocates into passives or even detractors if the brands fail to meet their expectation levels in terms of generating engagement .So apart from surveying customers to know what they think about you , ask them to furnish you with information about them. This helps in creating database of panels. Further , using a feedback or open messaging mechanism makes panelists feel valued as well provides them with an open platform to express themselves freely . It sends a message that the organization is actually interested in listening and acting upon what their customers have to say which prompts these customers to put their best foot forward and be as comprehensive as possible while participating in the research.
How to recruit survey panels using Voxco?
Voxco actively surveys and manages panel of respondents using Voxco Panel management system that integrates seamlessly with Voxco online . Selection and screening takes place that gathers 90 data points from each individual panelist. Research is distributed and collected within hours through an efficient distribution and collection process. Logic functions ensure error minimization to maintain the accuracy and authenticity of data. These specializef panels are carefully selected to meet the peculiar needs of organizations in the best possible manner.Explore Voxco Survey Software
Read more
%20(1).jpg)
Text Analytics & AI
Everything About Textual Analysis: Methods, Approaches, and Applications
Understanding Text: A Broader Perspective
When we think of "text," many of us immediately picture words on a page or messages on our phones. However, in academic terms, "text" encompasses much more. It refers to any form of communication that carries meaning—whether it's written, spoken, visual, or even non-verbal. This includes everything from books and articles to movies, music, advertisements, and even body language.
What is Textual Analysis in Research?
Textual analysis in research is the process of analyzing the language, symbols, and content of texts to reveal deeper meanings, patterns, and structures. Researchers use this method to interpret how specific texts communicate ideas, influence perceptions, and shape social, political, or cultural discourse.
Take, for instance, a political speech. Textual analysis can help researchers explore the rhetoric used, the ideological messages conveyed, and the potential impact on the audience's perceptions. By examining the text in detail, researchers can draw conclusions about the social, historical, or cultural implications of the speech.
Key Methods of Textual Analysis
Several textual analysis methods are used across different disciplines. Let’s explore the most common approaches:
1. Rhetorical Criticism
Rhetorical criticism focuses on understanding how texts persuade and influence their audience. Researchers systematically analyze the purpose, context, and strategies used in the text to evaluate its effectiveness. The process typically involves:
- Purpose: What is the goal of the message?
- Context: How do historical, cultural, and social factors shape the text?
- Impact: How does the text influence society or its audience?
- Theory: Can the analysis contribute to broader theoretical insights?
This method is particularly useful in media, political, and public discourse studies.
2. Content Analysis
Content analysis involves systematically identifying and quantifying specific elements within a text, such as recurring themes, words, or phrases. This can be done either qualitatively (analyzing the meaning behind the occurrences) or quantitatively (counting the frequency of specific elements).
- Qualitative Content Analysis: Focuses on understanding the deeper meanings embedded in the text.
- Quantitative Content Analysis: Involves counting occurrences of specific words or themes to identify patterns in large datasets.
While this method is often used to analyze large volumes of existing data, it can be a powerful tool for uncovering trends or shifts in discourse over time.
3. Interaction Analysis
Interaction analysis takes a broader view by examining both verbal and non-verbal communication. This approach is often used in studies of conversations, group dynamics, or media content. Researchers analyze:
- Linguistic Features: Word choice, sentence structure, and tone.
- Non-Verbal Communication: Gestures, facial expressions, and body language.
- Contextual Factors: Social, cultural, and situational influences on communication.
This method is particularly valuable in communication studies, social sciences, and qualitative research where understanding human interaction is key.
4. Performance Studies
Performance studies focus on the expressive and aesthetic elements of text. Researchers using this approach might perform the text themselves or observe how others interact with it. This process involves:
- Select: Choosing a text to examine.
- Play: Experimenting with different vocal and physical expressions.
- Test: Concluding how the text influences behavior or perceptions.
- Choose: Selecting the most valid interpretation of the text.
- Repeat & Present: Refining and presenting findings based on the analysis.
This method is commonly used in literary studies, theater, and cultural studies, where the performance of the text plays a critical role in understanding its meaning.
Where is Textual Analysis Applied?
Textual analysis finds applications in a wide variety of fields. Below are a few key areas where this method is particularly valuable:
1. Cultural and Media Studies
In media and cultural studies, researchers analyze a wide range of media—such as music, videos, advertisements, and images—as texts. By examining these forms, they can uncover the social and cultural contexts behind their creation and consumption. For instance, in a television commercial, textual analysis might explore how language, imagery, and symbolism influence consumer behavior.
2. Social Sciences
In the social sciences, textual analysis is often used to study interviews, focus groups, and other forms of communication. Researchers may employ quantitative textual analysis to count word occurrences or qualitative analysis to interpret the social meaning behind the text. This method helps sociologists, anthropologists, and psychologists uncover insights into human behavior, group dynamics, and societal trends.
3. Literary Studies
In literary studies, textual analysis is crucial for interpreting written works, including novels, poems, and plays. Researchers focus on how literary devices, such as metaphors, symbolism, and narrative structure, create meaning and convey deeper insights into human experience.
Key Takeaways:
Textual analysis provides researchers with a powerful tool to critically examine and interpret the vast array of texts that shape our world. Whether it's understanding political rhetoric, analyzing media representations, or interpreting literary works, textual analysis helps researchers draw meaningful conclusions from the texts we encounter daily.
For businesses, organizations, and academic researchers, this method unlocks deeper insights into how communication shapes perceptions, behaviors, and societal trends. By applying textual analysis methods across various fields, organizations like Voxco and Ascribe can leverage data to drive better decision-making, improve audience engagement, and enhance content strategy.
Read more

Market Research 101
Inferential Statistic: Whats and Hows
What is Inferential Statistics?
Inferential Statistics in quantitative research works in addition to Descriptive Statistics. Where descriptive statistics helps to summarize the characteristics of a sample population, inferential statistics focuses on using that summarized data and predict the characteristics for the larger population.
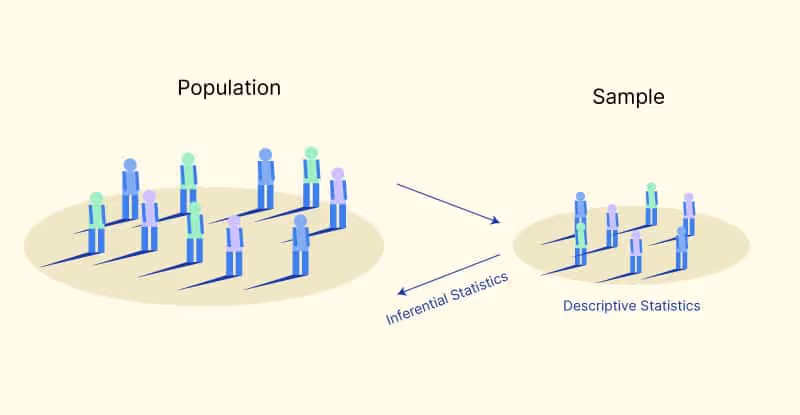
Hence, inferential statistics allows a researcher to make assumptions based on small populations, for the bigger populations. It uses measurements from the sample group and makes generalizations based on them for the larger groups. In essence to what is being said, if you want to identify whether the current statistics are descriptive or inferential, the key is that descriptive statistics works on your current sample data set and inference statistics work on concluding data in addition to your sample dataset which is comparatively huge.Example:You want to know the occupations of people in a village. You collect sample data from diverse villagers. After performing descriptive statistics on it, inferential statistics will give you an idea about what all occupations the rest of the villagers must be into.
What are the problems faced while collecting samples in Inferential Statistics?
- You have to make sure the sample data you select is diverse and random. This will avoid the results being biased. The sample data needs to be representative of the entire population for your assumptions to be accurate.
- Errors in sampling can happen when you don’t cover some data from the population in your data. It creates a difference between the actual values of the population and the values that you have measured. This can happen irrespective of the first point. Nevertheless, there are various probability sampling methods to help avoid this like Systematic sampling, Cluster sampling, stratified sampling as Simple Random sampling.
Ways of estimating population parameters from sample statistics:
It ideally tells us how to convert descriptive statistics to inference statistics. As the heading suggests, there are two characteristics:
- Parameter- Describes the entire population (mean of the population).
- Statistic- Describes the sample data (mean of the sample).
Inference statistics help us to use the sample statistic and describe the population parameter by taking sampling error into account and minimizing the difference between the two.
Types of estimating the population:
- Point Estimate- It uses the sample data to calculate a single value or point, a statistic that is the best estimate of a population parameter. It identifies a point in some parameter space.
- Interval Estimate- Unlike point estimate, interval estimate gives a range where the parameter is expected to belong to.
- Confidence Interval: Most common type of use of Interval Estimate. It is a range of values where the estimates are expected to fall on running the experiment again or on re-sampling. Hence, it is the mean of estimates which can fall on either on plus side or minus side of the variance (upper and lower bounds). Confidence level states the percentage of times we can expect the value to fall between the bounds. More the confidence level, the more the estimates are likely to fall in the same upper and lower bounds of the confidence interval.
What is Hypothesis Testing in Inferential Statistics?
It is a statistically followed process to testing the assumptions made depending on The morris sample data. Let’s take an example along with the five steps to be followed while performing Hypothesis Testing;
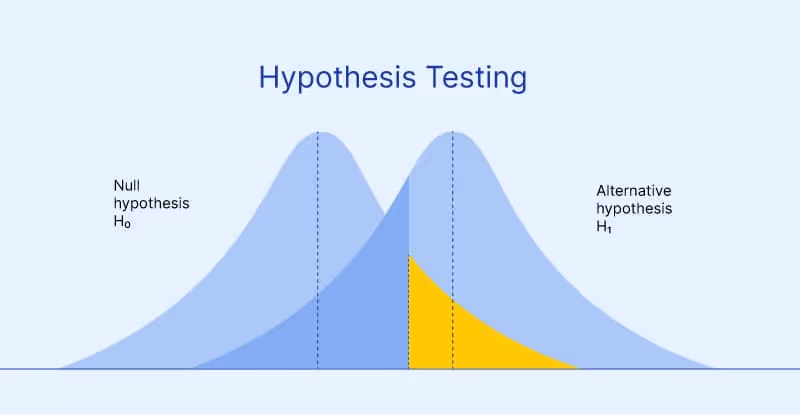
Step 1) State Null hypothesis (H0):
It is an already accepted fact. Analysts try to eliminate or nullify the null hypothesis.
Step 2) State the Alternate hypothesis (Ha):
It the opposite of the null hypothesis and analysts try statistically to prove the alternate hypothesis right. If it is proved that the alternate hypothesis is right then the null hypothesis is automatically rejected. And vice versa.
Step 3) Determine Significance Level (α):
It is a determiner that states the probability of the alternate hypothesis being right. It uses a significance level which tells how confident you are in your conclusion. Generally it is 0.05 (5%) to start with. If α=0.05, then it will mean that you can 5% support the alternate hypothesis (meaning reject the null hypothesis). But it would mean that you were wrong to reject the null hypothesis.
Step 4) Calculate p-value:
It is a probability value in favour of the null hypothesis. Significance level supports the alternate hypothesis, p-value supports the null hypothesis.
- High significance level -> alternate hypothesis (null hypothesis rejected)
- High p-value-> null hypothesis (alternate hypothesis rejected)Step 5) Conclusion:
On basis of the above conditions, you can accept or reject the hypothesis by looking at the percentage of p-value and significance level.Example:(H0)- Obese people are insecure about their weight.(Ha)- Obese people don’t let their weight pull down their self-confidence. (α)- 0.05P-value- 0.02Conclusion- on interviewing several obese people you found out that many people are body positive and are comfortable in their skin. P-value is 0.02 which is way low than the significance level of 0.05, you failed to prove the null hypothesis and thereby accept the alternate hypothesis saying obese people don’t let their weight pull down their self-confidence.
What are Statistical Tests in Inferential Statistics?
Useful to test out predictions and hypotheses, it also eradicates sampling errors.Parametric statistical tests- more powerful due to their defect detection. It does so by making assumptions regarding the normal distribution of scores, the definition of the population by sample data, etc.Non-parametric statistical tests- do not make any assumptions and are distribution-free tests.
What are the types of Statistical Tests in Inferential Statistics?
Comparison tests-
It looks for the differences in mean and medians or scores. To know which test approach will suit the aim, you need to check if your data meets the conditions for the respective tests.Type of Comparison testParametric?What’s being compared?Samplest-testYesMeans2 samplesANOVAYesMeans3+ samplesMood’s medianNoMedians2+ samplesWilcoxon signed-rankNoDistributions2 samplesWilcoxon rank-sum (Mann-WhitneyU)NoSums of rankings2 samplesKruskal-WallisHNoMean rankings3+ samples
Correlation tests-
Tell the level of association between two variables.Type of Correlation testParametric?VariablesPearson’srYesInterval/ratio variablesSpearman’s rNoOrdinal/interval/ratio variablesChi square test of independenceNoNominal/ordinal variables
Regression tests-
They show if you change the predicted variables whether it causes the output variables to change or not. Depending on the number of variables you have, you can decide whether to take the regression tests or not.Types of Regression testPredictorOutcomeSimple linear regression1 interval/ratio variable1 interval/ratio variableMultiple linear regression2+ interval/ratio variable(s)1 interval/ratio variableLogistic regression1+ any variable(s)1 binary variableNominal regression1+ any variable(s)1 nominal variableOrdinal regression1+ any variable(s)1 ordinal variable
Read more

Text Analytics & AI
What Is Thematic Analysis? Methods, Types, and Use in Research
In research, open-ended feedback often holds the richest insights—but it can be difficult to analyze at scale. That’s where thematic analysis becomes essential.
Whether you're a social researcher studying behaviors, a market researcher analyzing customer sentiment, or a corporate insights team uncovering employee concerns, thematic analysis helps transform qualitative data into structured, actionable insight.
What Is Thematic Analysis?
Thematic analysis is a method used to identify and interpret recurring patterns (or “themes”) in qualitative data. It’s especially useful for analyzing open-ended survey responses, interview transcripts, product reviews, and other text-based sources.
By organizing raw text into themes, researchers can surface what matters most—without being limited to numeric data. Today, AI-powered tools like Ascribe make this process faster, more consistent, and scalable across datasets.
How Thematic Analysis Works
At its core, thematic analysis in research follows these six steps:
- Familiarization – Reading through your data to get a high-level sense of the content.
- Coding – Highlighting keywords or ideas and assigning short labels ("codes").
- Generating Themes – Grouping similar codes into broader categories.
- Reviewing Themes – Refining themes to make sure they accurately reflect the data.
- Defining & Naming Themes – Giving each theme a clear focus and meaning.
- Writing Up – Interpreting and presenting findings in a compelling way.
Example: A software company collects survey responses from customers. Thematic analysis reveals key themes like “usability,” “customer support,” and “integration issues.” These insights guide product and CX improvements.
Types of Thematic Analysis
There are several types of thematic analysis, depending on your research goals and how you approach the data:
1. Inductive
Themes emerge directly from the data—ideal for exploratory research with little prior theory.
→ Example: Analyzing first-time users’ experiences without preset assumptions.
2. Deductive
Analysis is guided by existing theories or predefined categories.
→ Example: Validating known CX pain points using open-ended survey responses.
3. Semantic
Focuses on the surface-level meaning of the data—what people explicitly say.
→ Best for: Clear, direct feedback (e.g., product reviews or short comments).
4. Latent
Looks beyond what's said to interpret underlying beliefs, assumptions, or emotions.
→ Best for: Deep, qualitative interviews or behavioral research.
Why Use Thematic Analysis in Research?
- Empowers deeper insight: Understand motivations, perceptions, and pain points that numbers alone can’t capture.
- Highly flexible: Apply it across industries—from market research and social science to UX and HR.
- Compatible with AI: Platforms like Ascribe let you automate thematic analysis at scale, cutting time spent on manual coding while improving consistency.
- Rich storytelling: Thematic analysis supports both qualitative depth and quantifiable patterns—ideal for mixed-method research.
Best Practices for Thematic Analysis
- Use AI for consistency and scale: Manual analysis can be subjective. AI-enabled tools help you surface key themes faster and more objectively.
- Review edge cases: Don’t ignore less frequent responses—outliers often reveal emerging trends.
- Align themes to business goals: Use tags that link back to your research objectives, like customer satisfaction, churn drivers, or service gaps.
- Visualize results clearly: Pair your themes with visuals (charts, dashboards) to make them digestible for stakeholders.
Final Thoughts
Thematic analysis offers a practical way to turn open-ended feedback into meaningful conclusions. Whether you’re exploring consumer attitudes or employee engagement, the ability to uncover and quantify patterns in text is key.
When supported by the right technology, thematic analysis in research becomes not just manageable—but transformative.
Read more

Market Research 101
Computer Assisted Telephone Interviewing Software (CATI)
Research is the most important aspect through which a company can gather the relevant data required to make informed decisions. Many research models present in the market have made this data collection process easier and more efficient.
These research models focus on deciding the correct topic, picking the right audience with the relevant knowledge base that qualifies them as appropriate respondents, and asking them the right questions to analyze and predict accurately.
With the development of computerized learning and AI, the data collection process has become easier and simplified over the years.
Brands spend their own sweet time and resources going through multiple research methodologies and conducting feasibility studies to see if the method they choose is viable enough to be implemented.
One such method is CATI or computer-assisted telephone interviewing software. Let’s dive deep into what CATI is and its importance in this blog.
What is CATI?
In layman's terms, CATI is a research method that conducts survey research in a telephonic manner guided by a computer. The interviewer makes a call to the respondent and conducts the whole research over the telephone by using a script that is displayed on a computer instead of using the traditional paper-printed survey.
CATI surveys simplify the data collection by allowing agents to make notes about the respondent’s answers on the computer. Logic functions used by the software make the interviewing process dynamic. Using question randomization and repetition based on the answers provided by a particular respondent, you can customize the survey.
In addition, piping and branching techniques help to route to and skip questions based on what is relevant for a participant.
CATI survey software offers a better alternative to traditional data collection. It mixes the interpersonal touch generated by an interaction between company personnel and a respondent. Thus offering an easier way of collecting and sorting data that assist the interviewer in gathering relevant information without compromising quality.
Moreover, it allows the interviewer to focus on the interaction while leaving the complex work of managing data to the computer. This way, the interviewer gets to build a good conversation with the respondent, and the efficiency in data collection improves. Enhance your research process with an AI interview assistant to streamline interactions and gather precise data.
Also read: How to make automated phone surveys?
How does a computer-assisted telephone interview work?
CATI survey software allows you to design a survey questionnaire and program it to work seamlessly during a telephone survey. The tool allows agents to conduct telephone interviews by following the survey script.
The flexible and intuitive platform enables agents to log in to the answers on time and ask relevant questions based on the respondents' answers. This allows interviewers to focus on the respondent.
Also read: CATI in market research: Why it’s time to use Phone Surveys
Why leverage CATI for data collection?
Using cutting-edge phone survey software ensures faster data collection and a wider reach. All the while boosting engagement, increasing agents’ efficiency, & increasing response rates.
Here are six reasons why you should leverage computer-assisted telephone interview software for data collection.
01. Scalable:
CATI is a useful tool when it comes to collecting responses from respondents who are not easily accessible. It breaks down geographical barriers to make it easy for interviewers to collect data from a respondent anywhere simply by making a phone call.
This particular advantage of CATI makes it a better choice than personal interviewing, where a face-to-face interaction takes place between the respondent and the interviewer. This makes it easier to conduct large-scale studies in a short time period without any significant investment.
Using cloud-based CATI software enables you to scale the tool based on your organizational needs.
02. Customizable:
Respondents have a plethora of points of view, and these become more varied as the number of respondents goes on increasing.
Create tailor-made phone surveys using skip-logic, piping, or branching to ensure you ask respondents questions relevant to their experience. This provides the benefit of collecting precise data and eliminating any question or aspect that does not apply to the respondent.
03. Real-time monitoring:
When utilizing computer-assisted telephone interviewing, you can monitor the call's progress. You can supervise an ongoing call and monitor the live dashboard for completed cases, talk & idle time, etc.
Additionally, CATI software allows real-time synchronization and monitoring of data as and when interviews are complete. This benefit makes it easier to highlight and correct mistakes and track real-time progress to see if the study is progressing in the right direction.
Certain omnichannel survey software such as Voxco offers real-time data on the survey progress. It also integrates data from multiple types of research to provide a more holistic picture.
Seamlessly collect data with our integrated telephone survey software
- 99.99% Uptime
- On-Premise / Cloud Hosting Options
04. Good customer service:
For any respondent or customer, the interviewer represents the company for the period of the interview. The way an interviewer converses, his manner of speaking, and his tone can have a big impact on how the customer perceives the company image.
Allowing the interviewer to focus only on their interaction with the customer gives the interviewer freedom to build a good conversation with customers. This ensures the agent is not diverted by data collection and management. The computer does all the work while the interviewer can concentrate on rapport-building activities.
05. Quicker process:
Given that half of the work is automated by computer software, the process of collecting data through CATI is quicker than other manual methods. Sticking to the script and being concise offers the benefit of touching all the pain points in a timely and structured manner. This way you can ensure collection of the required responses and also meet the deadlines.
06. Ease of clarification:
Respondents might not understand certain questions or may feel that the choices offered are ambiguous. Such doubts about the clarity of the survey can easily be resolved through elaboration offered by the interviewer on call.
You cannot offer such clarification through online surveys, which makes CATI a better choice. The better the respondents understand the questions and the intention of the survey, the higher the quality of the feedback you gather.
Also read: 3 Types of Total Survey Error in Telephone Surveys
What are the cons of using CATI survey software?
There are some cons to using CATI as a mode of data collection. Here are two such disadvantages:
Designing takes time:
The process of collecting and navigating through the research may be efficient, but designing a questionnaire and entering it into the software can be time-consuming. Added to this is the typing speed and correctness of the interviewer.
The interviewer needs to be fast in entering the customer’s responses while making sure they do not miss out on any keywords that are essential for achieving the research purpose.
Modifications are difficult to incorporate:
Using logic functions in surveys makes it difficult to incorporate changes and update answers if respondents remember a part of the answer later on.
Research challenges that CATI counters
CATI software helps you interview your audience and gather accurate data faster than face-to-face surveys. Here are some of the challenges that computer-assisted telephone interview surveys help you resolve.
01. Lack of correlation:
The issue of not being to establish a correlation between two different research topics hampers the quality of decision-making that takes place using the data collected. By allowing real-time monitoring and dashboard inclusions, the researchers can combine two or more research results. This enables you to look at the bigger picture and establish a relationship between multiple research studies.
02. Dissatisfied respondents:
Respondents may not complete online surveys due to a lack of human touch or the survey length being too long, leading to non-response bias. By allowing the interviewer to concentrate on interacting with the respondent, the respondent gets to feel valued and respected. The interviewer can make sure that questions are answered to the fullest.
03. Geographical barriers:
Finding the right respondents may be easy, but getting in touch with them is difficult. That is the reason why most researchers go for convenience sampling. It is the process where respondents are selected on the basis of how easily they are available. With CATI, researchers do not need to rely on such a method, and they can carry out nuanced research without worrying about accessibility.
04. The number of respondents:
Researchers try to scale down the number of respondents they interview due to time constraints, lack of resources, and accessibility issues. With CATI in the picture, accurate data gets collected, and respondent accessibility is not an issue; the sample respondents can be maximized. Smaller samples can lead to inaccurate results due to sampling bias. This possibility is eliminated due to CATI.
05. Building long-term relationships:
Your customers walk out of a research process satisfied and content with the interaction they had, all because their opinions are valued. CATI brings good customer experience to the table so that long-term relationships are established, and satisfaction is kept top-notch.
Use cases of CATI survey software
Computer-assisted telephone interview survey software helps you reach your audience by phone and gather data without the need for face-to-face conversation. Market or social researchers, government agencies, and other organizations use telephone surveys to engage audiences whom they cannot reach with personal or online surveys.
1. Market research:
Brands can use phone surveys as a data collection method to gather insights into customers’ preferences, purchase behavior, and attitudes.
You can conduct phone surveys to
- Guage brand awareness,
- Gather feedback on new products or services,
- Understand customer experience and their satisfaction with the company’s products/services,
- Segment market based on demographic, geographic, behavioral, and other characteristics, and
- Gather competitive intelligence.
2. Political polling:
You can use CATI surveys in political campaigns to gather insights from voters about their opinions and preferences. Here are some ways you can use phone surveys in political polling:
- Track changes in voters’ preferences and gather their opinion on campaign messages.
- Conduct exit polls to understand how people vote and predict the result.
- Conduct focus groups to understand the voter’s concerns.
3. Social research:
Social scientists can use phone surveys to understand the beliefs, attitudes, practices, and behaviors of various groups in relation to societal issues.
Social scientists can use it for the following purposes:
- Gather data using social welfare surveys on social assistance, access to social services, housing, food, etc.
- Gather public opinions on social values, policies, and programs.
4. Health research:
Healthcare organizations can use phone surveys to track patients’ aftercare or explore individuals’ access to healthcare services. The insights can help organizations develop public health interventions and policies.
Here are some ways healthcare organizations can use phone surveys:
- Track patient satisfaction with the quality of care and access to healthcare services.
- Collect public information on healthcare utilization, types of services used, cost of healthcare services, frequency of visits, etc.
Overall, the CATI survey is a valuable tool for gathering insights from a wider population in a short amount of time. Using the data, organizations can make informed decisions and further follow up to gather in-depth insights.
Conclusion
CATI surveys are a valuable research tool, offering advantages such as faster data collection, control over the research process, high response rates, etc. It helps you reach an audience who may not be proficient in using mobile to take online surveys. Or those who you cannot reach even with field surveys.
Phone surveys allow you to avoid misinterpretation of questions, thus providing you with higher-quality data. It is quick and efficient, as agents can enter the data as they go through the interview. This means the software can automatically analyze the data right after the last interview ends.
This data collection method is a great example of technological advancement in this interconnected world.
Why Voxco is the right choice for you?
CATI survey software is an important research tool that can help desired end results. But the very act of selecting the right software that meets your needs can be a little difficult to find.
Here’s how Voxco makes a good case for the scale and nature of the study that you are looking to conduct:
- An omnichannel platform: Find everything you need in one place by combining our powerful Voxco CATI mode with Voxco’s Cloud Dialer and Voxco IVR. Create an integrated phone survey system of unparalleled efficiency.
- Dynamic survey design tools: The cumbersome part is made easy to create highly complex surveys with advanced question types and multiple conditions.
- Interviewer’s flexibility: The freedom for interviewers to switch between languages gives a personal touch to the interviewing process.
- Sophisticated fieldwork management tools: Maximize response rates with fieldwork tools like time zone management, interviewer roles, and smoothing functions.
- Phone survey software integration: Voxco CATI can be seamlessly integrated with an entire telephony system of your choice:
- Voxco Dialer offers automated, manual, or hybrid dialing modes to maximize dialing productivity.
- Optimize interviewing resources by blending inbound and outbound calls, and improve response rates by using Voxco IVR to handle returned calls.
FAQs
1. What is a CATI survey?
When you use a computer for interviewing and gathering feedback from a human, it is known as a CATI survey.
You can create a survey with an extensive logic function to ensure that you ask only relevant questions. Once the software connects a call to the respondent, the interviewer can read from the interviewer monitor the script with an introduction, instructions, and questions in it. The interviewer can select the code based on the respondent’s answer and log in the data.
2. How are CATI different from traditional phone surveys?
In a CATI interview, the agent gets assistance from a computer program to conduct a survey efficiently. The agent reads the survey questions from the screen and logs in the response, the software uses logic to show the next question based on the previous answer.
Whereas, on traditional phone surveys, the interviewer had to manually look for survey questions which meant longer research time and irrelevant questions.
3. What is the advantage of using CATI surveys?
It is more time and cost effective than face-to-face surveys. You can reach a wider audience where they are, thus helping you utilize your research time efficiently. The software also enables you to take time-zone into consideration.
Agents can focus on gathering data and so complete the survey project faster.
4. How long does it take to conduct phone interviews?
The length of phone surveys depends on factors such as the number of questions, the complexity of the question, and the number of respondents. Even with automated calls and sophisticated logic, a phone interview can last up to 10 to 20 minutes.
It’s important to keep the number of questions to a minimum. Too many questions can lead to survey fatigue and lower your response rate.
Read more

Market Research 101
Here’s what you need to know about Knowledge Panel Surveys
Conducting surveys and gathering data is easy. However, the right insights often get buried in the pile of noise. Visualizing survey data helps you tell a story by transforming the raw feedback into insightful data. By leveraging survey data visualization, you can easily identify trends, patterns, relations, and themes in the collected data.
Investigating survey data with a visualization tool empowers you with the right data to make informed decisions, propelling business growth. In this article, we’ll explore the benefits of utilizing survey data visualization tools and how to visualize survey data.
What is Knowledge Panel?
A KnowledgePanel survey is a research method that uses a carefully chosen group of people to collect information on different subjects. Unlike typical surveys, which often pick people randomly, KnowledgePanel surveys use a more focused method. This ensures a diverse and accurate sample that truly represents the group being studied.
Witness the power of omnichannel engagement and take your research to new heights with Voxco.
Embark on your journey towards data-driven success!
How does a Knowledge Panel survey work?
Panel members are selected randomly to ensure that survey results accurately represent the population, with a high level of accuracy. This level of precision is not achievable with non-probability panels. KnowledgePanel has improved its recruitment process by using Address sampling (ABS) instead of the Random Digit Dialing (RDD) method.
ABS sampling, which is based on probability, helps increase coverage of the population and establishes a robust sampling system for reaching individuals who are typically hard to reach. This includes people from minority groups and young adults. With ABS recruitment, households without internet access are provided with a web-enabled device and free internet.
Once participants accept the invitation to join the panel, they complete a brief demographic survey known as the core profile survey. The information collected in this survey is essential for future panel sampling. Successful completion of the core profile survey allows participants to become active panel members. Additionally, all respondents receive similar privacy and confidentiality protections.
A look inside ABS Recruitment
The recruitment process uses probability-based sampling from addresses listed in the USPS Delivery Sequence File. ABS methodology has a big advantage: it allows sampling of entire delivery points regardless of whether they have a telephone. By using existing data about addresses, it helps plan how to represent different subgroups accurately based on attrition rates.
- Hispanic age range 18-30
- Non-Hispanic age range 18-30
- Hispanic age range 31+
- Non-Hispanic age range 31+
From the randomly sampled addresses, the adults receive an invitation to join the Knowledge Panel every quarter. This happens over a series of contact attempts, comprising of an invitation letter, a postcard for reminding, and a continuous follow-up letter. In order to join the panel, the invited households should:
- Complete and mail back the paper form via a postage-paid envelope
- Call a toll-free number associated with GfK
- Go to a specific GfK website and fill out the recruitment form
Recruiting household members
The members of the entire household are enumerated at the time of the initial recruitment survey. Post enumeration, each household member equal to or above the age of 13 years can be recruited for participating in the Knowledge Panel survey. However, it’s important to take consent from the parents or guardians for the initial recruitment interview of the household members that are 13 -17 years old.
Survey Sampling
Once the panel members are successfully recruited as well as profiled, they are eligible to be selected for client surveys. Based on the study design, stratified random sampling is seamlessly carried out on the profile data.
The basic rule of sampling is not assigning individual members more than a single survey every week. In the case of certain exceptions, this confines the total assignments of a member to 4 or 6 surveys every month. If a survey sample requires prescreening, then members are usually drawn from a panel’s subsample (like females, window shoppers, republicans, etc.).
Survey Administration
Once assigned to a survey, members receive an email notification whenever a new survey is available. This email contains a link that takes them directly to the survey questions, without needing a login or password. The field period for surveys can last anywhere from a few hours to several weeks, depending on the client's requirements.
After three days, automatic email reminders are sent to panel members who haven't responded. If these reminders don't get the desired response, telephone reminder calls are made. It's standard protocol to wait at least 3 to 4 days after sending email reminders before making phone calls.
Panel members are typically expected to complete one survey per week or four surveys per month. Each survey should take between 10 to 15 minutes to complete.
Survey response rates
The response rate reporting for Knowledge Panel surveys is in accordance with the AAPOR standards. The AAPOR standards were originally designed with single survey administrations in focus. However, the response rates for KnowledgePanel surveys are calculated using algorithms developed by Callegaro and DiSogra in 2008.
Mostly, about 65% of people finish these surveys. The rate might change a bit depending on things like how long the survey is or what it's about.
What are the advantages of Knowledge Panel surveys?
Fairly nice compensations
In Knowledge Panel surveys, every survey session of 10-15 minutes is likely to help you earn approximately $1. If you earn $1 per week that means you can easily earn $60 per year. While the money isn’t too much but it is certainly a great incentive for an interesting activity!
Turn points into cash
You can easily transform your points into cash. It also lets you turn them into either gift cards or even sweepstakes entries!
Open for all household members
Every member of the family is free to join. So, every time that letter gets into your mailbox, it could be either for you or any other single member of the household.
What are the disadvantages of Knowledge Panel surveys?
Exclusive Panel
Receiving the invitation isn’t an easy task. The panels are extremely exclusive and only limited households really get the invitation. Even the partners are not authorized to send invitations.
High Checkout Threshold
Knowledge Panel surveys require cash out of $25 due to which they do not stand out among the existing competitors.
Increased Survey Length
Many users say that the KnowledgePanel surveys keep on becoming lengthy with time. As the payment is not done on an hourly basis, the increasing length of surveys can lead to frictions.
Conclusion
To sum up, KnowledgePanel surveys are a dependable way to collect data that represents public opinions and behaviors accurately. Using probability-based sampling, they give valuable insights across different fields. Although they face challenges like limited access and long surveys, platforms like Voxco help improve their effectiveness. Overall, KnowledgePanel surveys are crucial for making informed decisions and understanding societal trends.
With platforms like Voxco, researchers can fully utilize KnowledgePanel surveys to gain valuable insights, guiding decision-making and creating meaningful impact.
Read more