Voxco and Ascribe Join Forces to Enhance Your Research Capabilities
Take a peek at our powerful survey features to design surveys that scale discoveries.
Explore Voxco
Need to map Voxco’s features & offerings? We can help!
Get exclusive insights into research trends and best practices from top experts! Access Voxco’s ‘State of Research Report 2024 edition’.
We’ve been avid users of the Voxco platform now for over 20 years. It gives us the flexibility to routinely enhance our survey toolkit and provides our clients with a more robust dataset and story to tell their clients.
Steve Male
VP Innovation & Strategic Partnerships, The Logit Group
Explore Regional Offices
Find the best survey software for you!
(Along with a checklist to compare platforms)
Take a peek at our powerful survey features to design surveys that scale discoveries.
Explore Voxco
Need to map Voxco’s features & offerings? We can help!
Find the best customer experience platform
Uncover customer pain points, analyze feedback and run successful CX programs with the best CX platform for your team.

We’ve been avid users of the Voxco platform now for over 20 years. It gives us the flexibility to routinely enhance our survey toolkit and provides our clients with a more robust dataset and story to tell their clients.
Steve Male
VP Innovation & Strategic Partnerships, The Logit Group
Explore Regional Offices
SHARE THE ARTICLE ON
Customer metrics refer to measuring factors or tracking them about your customers. These factors are metrics that affect the company’s growth and revenue through customers. Customer metrics can be measured with customer satisfaction, loyalty rates, retention rates and much more. Example, a company measures its customer satisfaction rate through a survey regarding a product.
Customer metrics are generally reflected in numeric form and are summarized from surveys and forms given to customers to share their views.
See Voxco survey platform in action
Take a tour of our platform with on-demand survey demos
The Average Revenue Per Account (ARPA), also known as Monthly Recurring Revenue (MRR), is a metric that measures how much money each customer brings in each month.
This statistic aids in the classification of high- and low-revenue products and services, particularly when it comes to product segmentation. These insights can assist highlight how beneficial an organization’s services are to its clients, and can help promote upsells and cross-sells.
For example, if ARPA grows within the existing customer base (and no new clients are signed), your customers see value in your services and allow their expansion.
Because most B2B Software as a Service (SaaS) companies and digital marketing agencies calculate ARPA over a period of many months to a year, because these services are frequently subscription-based or held on a monthly basis.
Calculating ARPA: Total Revenue / Total number of customer
The Net Promoter Score® (NPS®) is a metric for determining customer loyalty and, as a result, the likelihood of future purchases and referrals. A Net Promoter Score® determines whether or not a customer is likely to suggest your business.
This score is based on a numerical poll in which customers rate their overall satisfaction with your company on a scale of one to ten. By asking participants to explain their score, you can gain a better understanding of your overall client experience while also uncovering any unusual or outlier sentiments.
Remember how we talked about how important it is to create relationships? In that analysis, this is the metric that will be most useful. Finally, based on your current client base and how likely you are to obtain referrals, NPS® acts as a proxy for possible growth.
Voxco offers easy-to-use online survey software
Calculating NPS®: % of Promoters – % of Detractors
“On a scale of 1 to 10, how likely are you to recommend this product or service?” send a message to your consumer base. Also, offer a message section underneath to give your consumer a chance to explain their response.
After you’ve gathered all of your feedback, divide the percentage of promoters by the percentage of detractors.
To accurately calculate your NPS® score, you’ll need to count the number of promoters — those who gave you a 9 or 10 on a scale of 1 to 10 — and detractors — those who gave you a 6 or lower on a scale of 1 to 10. Passive customers are those who marked 7 or 8.
You have a positive NPS® score of 50 if the percentage of promoters is 65 percent and the percentage of critics is 15 percent. If we reverse those statistics, for example, if your promoter rate is 19 percent and your detractor rate is 62 percent, you’ll get a negative NPS® score of -43.
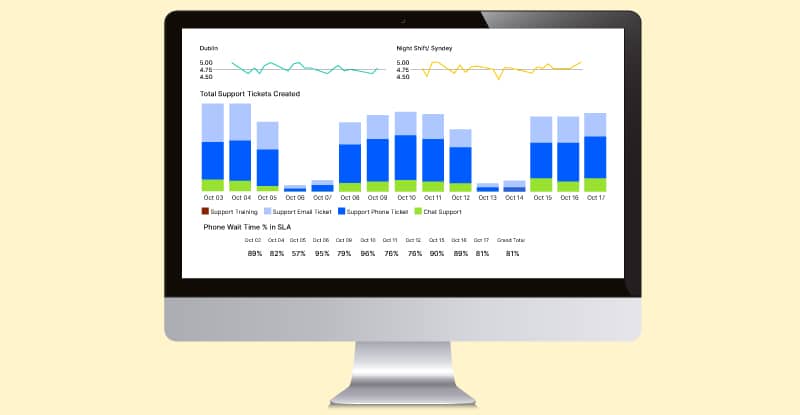
A low score can disclose evident faults with your customer service personnel, such as a delay in responding to support tickets or extended hold periods on the phone.
You’re one step closer to discovering your strongest and weakest points of operation if your customers add rationale to their score.
Consider tracking your Customer Satisfaction Score in addition to NPS®. Though CSAT and NPS® have a lot in common, they provide different perspectives on success.
CSAT is calculated at predetermined periods, such as just after a purchase, during onboarding, during a customer support interaction, and so on. Analyzing the appeal of certain points of contact can help you lower your churn rate and boost your NPS®, CLV, and ARPA.
CSAT, like NPS®, is based on a customer service survey. A simplified scale with numeric options ranging from one to ten can also be used.
Calculating CSAT%: (#) of Positive Responses / (#) total responses X100
Browse through all that Voxco surveys have to offer!
The entire revenue a company may expect to make from a single customer over the course of their relationship is measured by Customer Lifetime Value.
This is one of the most basic customer success indicators, and it can help you evaluate the value of your customers over time along with money you’ll need to spend to acquire new ones.
Furthermore, calculating CLV will highlight your most devoted consumers and give you insight into how to increase their value to you.
After all, increasing income from a loyal client is far easier than increasing revenue from a new customer, so here is your moment to focus on and meet their demands.
Calculating CLV method 1: ARPA / Churn Rate (make sure that both ARPA and Churn Rate are calculated monthly)
Calculating CLV method 2: (ARPA * Gross Margin %) / Revenue Churn Rate (for differing ARPA across the customer base)
If math isn’t your thing, you can calculate CLV by multiplying average buy value by average purchase frequency, then dividing it by average customer longevity (this is a solid formula for e-commerce stores).
If your CLV increases over time, it means that your clients are finding success with your services and are more likely to collaborate with you in the future.
If your CLV is decreasing, you can expect a breakdown in your customer success team or a lack of value in your products.
Customer journey analytics set up correctly may automate the calculation of your customer’s lifetime value in real time.
The Customer Churn Rate measures how many customers a company keeps.
There are a few indicators that your turnover rate is high:
Every firm needs its own set of signs. Not all businesses, for example, provide subscription-based ordering or services. To begin, determine how your churn is represented before calculating Customer Churn Rate.
Keep in mind that the majority of clients are more loyal than you might believe. Unless you’re truly bad at customer service, they won’t just leave and go somewhere else right away.
Furthermore, if you provide value to your consumers in addition to your products or services (which we’ll discuss further down), you’ll have a far higher chance of lowering your Customer Churn Rate. With this in mind, the Customer Churn Rate is an excellent indicator for getting a bird’s eye view of how well particular salespeople are working.
Voxco offers a complete suite of tools for market research
Calculating customer churn rate: # of Customers Terminating within a Timeframe / Number of Customers at the Start of the Timeframe.
Make sure to omit the number of new customers who joined your ranks that month when calculating your churn rate. The following is an example of a calculation:
If you had 50 clients at the beginning of the month and seven of them did not renew or pull out of the contract, your churn rate would be 14% (7 / 50 = 0.14 * 100 = 14%).
Using Customer Engagement to Reduce Churn
Yes, by simply providing value to your customer experience, you can reduce churn rate. This can be accomplished in a variety of ways. Publishing value-centric content that provides insights, solves issues, and improves the usability of your goods, on the other hand, is the most feasible and sustainable strategy.
Answering topics that your audience hasn’t considered is a terrific method to help clients create trust and cultivate loyalty.
As a result, they help to build trust in their understanding of their products or services. An authentic and proactive content strategy, when effectively implemented, may significantly reduce churn and increase CLV.
Customer Retention Cost is the amount of money spent by a company to keep and strengthen customer relationships. This is the total cost of all customer service and interaction aimed at retaining customers.
Finally, CRC indicates the return on investment (ROI) for consumer monetization efforts and can assist drive future business investments, such as whether you should improve your customer success team or roll out a new initiative or product.
Customer Relationship Cost (CRC) differs from Customer Acquisition Cost (CAC) in that firms invest in nurturing existing relationships rather than generating new leads.
Voxco’s Visual Analytics Dashboards provide insights that aid decision-making
Though both are important parts of business growth, CRC has a higher inherent value because most businesses, particularly B2B SaaS businesses, rely on long-term connections to succeed.
Furthermore, CRC is a clear predictor of your perceived reputation because it shows the quality of the consumer-brand relationship
If your CRC exceeds your ROI, for example, you might expect a breakdown in your customer service team or a product issue that costs you time, money, and glowing customer reviews/referrals.
When calculating CRC, business owners must take into account a variety of elements that range from one company to the next. Some things that may have an impact on CRC include:
Calculating CRC: CRC is not calculated using a widely agreed formula. In many cases, however, figures can be derived by tracking purchases over time while accounting for retention costs, churn, and general overhead.
This is also a well-known formula:
CRC = Cost of {Customer Success Team + Renewals and/or Account Management Team + Customer Engagement Programs + Professional Service & Training + Customer Marketing}
Supercharge your survey insights with Voxco
Each company is different, but we all have the same goal: to make our customers’ lives better by providing exceptional products and services.
Measuring your customer success KPIs is the best approach to be proactive in giving your customers _more —more value, more reason to buy-in, more incentive to stay loyal, more reason to refer. If you’ve never considered these calculations before, or if you have, but aren’t sure how to get the data you need, remember that it’s never too late to begin. If you’re looking for a way to keep track of your customer data, customer analytics and product analytics are both excellent options.
See how you can conduct cost-effective research with Voxco
Use this guidance as a starting point for keeping track of your accomplishments and failures. Also, don’t forget to look at all six customer service indicators. Otherwise, you may never be able to scale your business by truly balancing its operations.
Net Promoter®, NPS®, NPS Prism®, and the NPS-related emoticons are registered trademarks of Bain & Company, Inc., Satmetrix Systems, Inc., and Fred Reichheld. Net Promoter Score℠ and Net Promoter System℠ are service marks of Bain & Company, Inc., Satmetrix Systems, Inc., and Fred Reichheld.
Explore all the survey question types
possible on Voxco
Read more
We use cookies in our website to give you the best browsing experience and to tailor advertising. By continuing to use our website, you give us consent to the use of cookies. Read More
Name | Domain | Purpose | Expiry | Type |
---|---|---|---|---|
hubspotutk | www.voxco.com | HubSpot functional cookie. | 1 year | HTTP |
lhc_dir_locale | amplifyreach.com | --- | 52 years | --- |
lhc_dirclass | amplifyreach.com | --- | 52 years | --- |
Name | Domain | Purpose | Expiry | Type |
---|---|---|---|---|
_fbp | www.voxco.com | Facebook Pixel advertising first-party cookie | 3 months | HTTP |
__hstc | www.voxco.com | Hubspot marketing platform cookie. | 1 year | HTTP |
__hssrc | www.voxco.com | Hubspot marketing platform cookie. | 52 years | HTTP |
__hssc | www.voxco.com | Hubspot marketing platform cookie. | Session | HTTP |
Name | Domain | Purpose | Expiry | Type |
---|---|---|---|---|
_gid | www.voxco.com | Google Universal Analytics short-time unique user tracking identifier. | 1 days | HTTP |
MUID | bing.com | Microsoft User Identifier tracking cookie used by Bing Ads. | 1 year | HTTP |
MR | bat.bing.com | Microsoft User Identifier tracking cookie used by Bing Ads. | 7 days | HTTP |
IDE | doubleclick.net | Google advertising cookie used for user tracking and ad targeting purposes. | 2 years | HTTP |
_vwo_uuid_v2 | www.voxco.com | Generic Visual Website Optimizer (VWO) user tracking cookie. | 1 year | HTTP |
_vis_opt_s | www.voxco.com | Generic Visual Website Optimizer (VWO) user tracking cookie that detects if the user is new or returning to a particular campaign. | 3 months | HTTP |
_vis_opt_test_cookie | www.voxco.com | A session (temporary) cookie used by Generic Visual Website Optimizer (VWO) to detect if the cookies are enabled on the browser of the user or not. | 52 years | HTTP |
_ga | www.voxco.com | Google Universal Analytics long-time unique user tracking identifier. | 2 years | HTTP |
_uetsid | www.voxco.com | Microsoft Bing Ads Universal Event Tracking (UET) tracking cookie. | 1 days | HTTP |
vuid | vimeo.com | Vimeo tracking cookie | 2 years | HTTP |
Name | Domain | Purpose | Expiry | Type |
---|---|---|---|---|
__cf_bm | hubspot.com | Generic CloudFlare functional cookie. | Session | HTTP |
Name | Domain | Purpose | Expiry | Type |
---|---|---|---|---|
_gcl_au | www.voxco.com | --- | 3 months | --- |
_gat_gtag_UA_3262734_1 | www.voxco.com | --- | Session | --- |
_clck | www.voxco.com | --- | 1 year | --- |
_ga_HNFQQ528PZ | www.voxco.com | --- | 2 years | --- |
_clsk | www.voxco.com | --- | 1 days | --- |
visitor_id18452 | pardot.com | --- | 10 years | --- |
visitor_id18452-hash | pardot.com | --- | 10 years | --- |
lpv18452 | pi.pardot.com | --- | Session | --- |
lhc_per | www.voxco.com | --- | 6 months | --- |
_uetvid | www.voxco.com | --- | 1 year | --- |