.svg)
The Voxco Answers Anything Blog
Read on for more in-depth content on the topics that matter and shape the world of research.


Text Analytics & AI
The Latest in Market Research
Research Quality in the Age of AI
A few weeks back I watched a newly onboarded research team deliver what used to take them three weeks in under 48 hours. AI Coder analyzed and categorized several thousand open-ends, helped create cross-tabs and ASK drafted initial insights.
Then came the email that changed everything.
"Why did the AI group these specific responses differently than our first wave?" And just like that it felt like we were back at "you can have it fast, OR you can have it good."
The Speed vs. Quality Dilemma
We're rushing to integrate AI into every aspect of research, from survey design to reporting. But in our efficiency-driven glee, we're tripping over a quality issue we didn't prep a helmet for.
LLMs can process thousands of responses in minutes, but there's a catch. Generative AI models can, and do, produce different results from the same exact inputs depending on the temperature settings, random seeds, or even the time of day you run them. Throw the same 1,000 responses into ChatGPT and you're guaranteed to get different categorizations. Not wildly different, most of the time, but different enough to shift your strategic recommendations.
The Real Problem: Magic vs. Math
At Ascribe, we've processed over 50 million open-ends in our lifetime. A significant portion in the past year were using AI, and what we've learned is AI does not work without human intelligence in the mix.
The problem isn't the technology itself. It's pretending AI is magic instead of math. It's applying an older framework to fundamentally new processes. We're claiming to maintain rigorous methodology up until the moment we hand the reins over to an AI we don't fully understand.
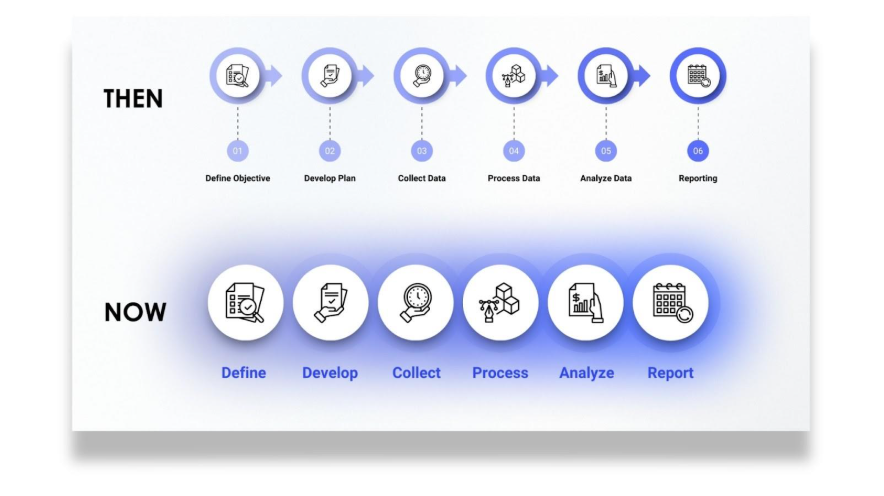
The Three Pillars of Research Quality: Then and Now
For decades, research quality rested on three pillars. These same three pillars stand today, but are made of slightly different materials:
- Representative Data now also includes training data. Can your AI handle medical terminology while also being asked to categorize social reviews of the newest haute cuisine restaurant specializing in microgreens planted exclusively on every third Wednesday of the month? The answer depends as much on the AI's training data as on your sample demographics.
- Sound Methodology has expanded to AI algorithms and prompt crafting. It's not enough to have a good sampling plan if your AI is introducing systemic biases.
- Human Oversight has become even more critical but requires a new approach. When an AI processes 10,000 responses in under 10 minutes, how do you review the results in a meaningful way? The sheer volume can make traditional quality checks feel like inspecting a river with a spork.
Building Guardrails: A Practical Framework
Successful research teams aren't the ones avoiding AI. They are building guardrails and processes that make their results explainable, while leveraging AI tools that allow for transparency.
- Establish consistency benchmarks: Run the same data set through your AI solution multiple times. Note where it drifts and where the results are reproducible. Document the areas you know you will always need to verify.
- Demand confidence scores: Ask for easily accessible and understandable confidence scores to gain insights into when the AI is approximating a grouping of ideas. Establish a baseline and check anything that drops below it.
- Create audit trails: Document successful, and especially unsuccessful, outputs and the AI settings and decisions that got you there. This creates yet another audit trail that allows you to build trust and confidence.
- Implement staged review: This may be the most important part of the process. While the previous steps are important during adoption, staged review should be part of each project you involve AI in. Do what makes sense for your team and provides the most peace of mind.
Real-World Review Strategies
We've seen everything from hybrid approaches where teams require human review of any category that captures less than 5% or more than 30% of responses, to teams that have developed enough trust and understanding of the platform so that they only require targeted human review of specific findings they've identified as needing intervention.
"The new standard for research quality isn't lower or higher, it's different. Clients are buying trust in processes they can't fully see."
The Trust Factor
When you tell clients that AI was involved, they need to know you haven't sacrificed rigor for speed just to meet their deadline. The teams that thrive in the current market aren't those who resist AI or those who blindly incorporate it into every facet of their work. They're the ones that develop frameworks for quality that take into account both AI's power and its limitations.
The efficiency metrics of AI in research are seductive: faster turnarounds, larger sample processing, and the ability to find needles in a haystack of noise. But AI is a tool and not a replacement for human intelligence in research.
The Bottom Line
The question isn't really whether to use AI in research—that ship has sailed. The question is whether we'll use it in a way that enhances our credibility or erodes it.
The answer lies not in choosing between speed and quality, but in building new frameworks that deliver both.
Read more
%20(1).jpg)
Text Analytics & AI
Beyond the Black Box: A Framework for Responsible AI Integration in Survey Research
The integration of AI into survey research represents the most significant methodological shift we've seen since moving from paper surveys to digital platforms. Unlike previous technological advances, however, this one challenges fundamental assumptions about researcher control, transparency, and scientific rigor in ways that deserve our careful attention.
Let’s be clear: AI didn’t wait for our permission. It’s already here, embedded in the platforms we use to analyze open-ended responses, check data quality, and generate predictive models. The question is no longer whether AI belongs in survey research, but how we’ll shape its integration before it shapes us.
From my perspective, thoughtful integration beats both wholesale rejection and indefinite postponement. The AI capabilities I've encountered can genuinely transform how we work. For example, processing thousands of open-ended responses that would strain traditional coding budgets and identifying patterns in survey data that even experienced researchers might miss. We're not talking about marginal improvements; these represent efficiency gains that can fundamentally expand what's possible in our research.
What concerns me is if we risk compromising our methodological standards for convenience. The real challenge isn't choosing between AI and quality, it's ensuring we don't compromise the rigor that makes our work valuable. We can have both powerful AI tools and solid research practices, but it won't happen by accident.
The Stakes Are Higher Than We Think
We’re not simply adopting new tools. We’re grappling with core questions: What happens to the scientific method when algorithms drive analysis? How do we preserve peer review integrity when analytical processes become opaque? Can we reproduce our findings when our methods depend on proprietary black-box systems?
The survey research we produce informs policy decisions, shapes business strategies, and contributes to our understanding of human behavior. When we compromise research quality for efficiency, we're not just affecting our work; we're potentially undermining a critical knowledge base our society relies on.
Six Areas Where Survey Research Is Most Vulnerable
1. The Black Box Problem
Many AI tools offer impressive outputs with little to no visibility into how they work. For researchers who rely on methodological transparency, that’s a red flag. If we can’t explain what’s happening behind the scenes, we can’t defend the results.
2. Reproducibility Challenges
If I can’t describe precisely how a result was produced, how do I justify it to a reviewer or replicate it in future studies? With AI, reproducibility often becomes obscured by opaque processes. In a field already dealing with a replication crisis, that’s dangerous.
3. Bias and Data Security Risks
AI learns from existing data, which often contains historical biases. Without continuous testing, we risk reinforcing inequality rather than revealing it. Concerns about how AI handles personally identifiable information (PII) raise the stakes even higher.
4. Loss of Researcher Control
Good research depends on professional judgment, context awareness, and critical thinking. If tools automate decisions without the researcher’s input, we risk turning thoughtful analysis into meaningless output.
5. Data Privacy and Compliance
Regulated environments like government, health, or academia demand strict control over PII and data use. Many AI systems weren’t built with these requirements in mind, raising red flags for compliance, IRBs, and ethics boards.
6. Organizational Policy Barriers
Even when researchers are eager to use AI, many institutions lack a clear policy, and regulatory hurdles can hinder implementation. In some cases, one department runs AI pilots while another is restricted from using those same tools, creating confusion and slowing adoption.
The Reality of Fragmented Adoption
What makes this transition particularly challenging is that adoption is uneven even within the same organization. Some departments experiment with AI quietly, while others enforce strict guardrails. This inconsistency creates confusion and reinforces caution among researchers who aren't sure which approach their institution will ultimately endorse.
Rather than waiting for organization-wide AI transformation, I'm seeing adoption happen more organically as team- or department-level experiments, especially in regulated environments. This grassroots approach enables researchers to validate AI tools within their specific contexts while gradually building institutional confidence.
What Researchers Want
When I talk with fellow researchers, their priorities are clear. They’re not looking for one-click AI. They’re asking for:
- AI-assisted open-end text coding that can handle large volumes of responses while maintaining coding consistency and allowing for human oversight and refinement.
- AI that helps interpret responses and suggest follow-up questions during survey development or analysis phases, essentially serving as an intelligent research assistant.
- AI tools that calculate validity or risk scores for survey responses to assist with quality control, flagging potential issues without automatically removing responses.
- Integrated feedback loops where humans can shape or refine AI outputs over time, rather than simply approving or rejecting one-time results. Researchers want systems that learn from their corrections and preferences.
These requests reflect a sophisticated understanding of AI's potential role: not as a replacement for human judgment, but as a tool that can extend human capabilities while maintaining researcher control.
A Framework for Responsible Integration: AI + HI
We need standards, not slogans. Here’s my proposed framework:
1. Proof of Performance
Platforms should provide validation reports that include inter-rater reliability benchmarks, subgroup performance, and error rates. Don’t ask to see the training data that these companies cannot realistically provide; instead, ask for evidence that the system works in contexts like yours.
2. Researcher-in-the-Loop Control
AI suggestions must be editable and optional, with no black-box automation. Researchers must retain complete oversight of inputs, outputs, and implementation.
3. Reproducibility Tools
Every action should be logged, time-stamped, and documented. Even if LLMs can’t give perfect repeatability, we can insist on complete documentation of model settings, prompts, and outcomes.
4. Real-Time Bias Monitoring
Platforms must support ongoing bias checks across key subgroups. When models are pushed beyond their tested range, researchers should be alerted and prompted to exercise increased oversight.
Before You Adopt—Ask These Questions
When evaluating AI-powered survey research tools, ask:
- How does the platform validate performance across different demographic groups?
- What happens when the AI is applied to unfamiliar data?
- What control do I have over the final analysis?
- Will I receive complete documentation for peer review or compliance?
- What does the training and onboarding process look like?
A Realistic Path Forward
No, this won’t be seamless. Implementation of new technologies takes time. Your first few projects will be slower. You’ll need validation protocols, training time, and expert oversight. But once integrated thoughtfully, the gains are substantial: faster coding, multilingual support, and measurable cost savings. The key is approaching adoption with realistic expectations and robust validation protocols, rather than relying on blind faith in efficiency promises.
Regulatory and Professional Considerations
For institutions concerned about compliance, the best AI platforms now work directly with IRBs and data protection authorities to provide standardized language for research protocols involving AI assistance. Legal teams have developed template disclosures that satisfy most institutional requirements and provide compliance documentation for GDPR, HIPAA, and other regulatory frameworks.
Our professional associations should establish industry-wide standards for AI validation in survey research, including requirements for documentation, bias testing, and oversight by researchers. We need clear guidelines about when AI assistance requires special disclosure in publications and how to maintain professional liability when using automated tools.
Smart Engagement, Not Reckless Adoption
I'm not advocating reckless adoption; instead, I’m arguing for thoughtful engagement. AI capabilities are advancing whether we participate or not. The question isn't whether our field will change, but whether we'll help shape that change or react to whatever Silicon Valley builds for us.
The opportunity here is substantial. We can analyze open-ended responses at scales that were previously financially impossible. We can identify subtle patterns that would take human coders weeks to find. We can accelerate research timelines without sacrificing quality. However, none of this happens automatically; it requires us to stay engaged, remain critical, and continue pushing for tools that serve research excellence, not just efficiency metrics.
We have more influence over this process than we might realize. The companies developing these tools are responsive to our requirements, but only if we're clear, realistic, and unified about what those requirements are. If we approach AI integration thoughtfully, we can help create tools that truly serve our research needs rather than forcing us to adapt to technological limitations.
What This Means for Our Field
The future of survey research depends on our willingness to engage constructively with these technologies. We need to be neither uncritical early adopters nor reflexive resisters. Instead, we need to be research leaders who help shape AI development in ways that serve scientific inquiry.
This means participating in validation studies, sharing our experiences with AI tools, and collaborating with developers to create systems that meet our professional standards. It means training the next generation of researchers to think critically about AI capabilities and limitations while embracing the genuine advantages these tools provide. And it means maintaining the methodological rigor that has always been essential to good science, even as we adopt new ways of achieving it.
The most effective AI tools won't replace researchers; they'll make us more capable. But that outcome isn't guaranteed. It requires us to stay engaged, demand better, and refuse to accept tools that force us to choose between efficiency and rigor.
We're at a crossroads. We can let AI happen to our field, or we can actively shape its development. I believe we have both the opportunity and the responsibility to choose the latter path.
Dr. Michael W. Link is a leading voice in survey research methodology and AI integration. His work focuses on maintaining research excellence while embracing technological innovation.
Read more

The Latest in Market Research
Text Analytics & AI
Are Your Survey Questions Getting the Whole Story? AI Probing Might Prove You Wrong
If you’ve worked with surveys, you’ve probably run into this: you ask an open-ended question, hoping for gold, and you get... “It was fine.” Not very helpful, right?
You know the respondent has something more to say, but the survey just moves on. No follow-up, no context, no real insight. That’s where something called "AI probing" starts to make a big difference. It's not a buzzword. It’s a practical tool that helps you ask better questions and actually get better answers.
What’s AI Probing, Anyway?
In short, AI probing means your survey doesn’t stop at the first answer. It looks at what the respondent said, and if it seems vague or incomplete, it gently asks a follow-up. Not pre-written, not generic — but relevant, on the spot.
Imagine someone responds: “The product was confusing.”
The AI might follow up with: “Can you tell us what part was most confusing?”
That second question is what often leads to the real insight.
Why Does This Matter Now?
Let’s be honest: people don’t always give thoughtful responses. They're tired. They're rushing. They don’t always know what kind of detail you're after. Without some light nudging, you risk getting shallow data that’s hard to use.
With AI probing, you're able to:
- Clear up vague responses before the survey ends
- Get people to explain their thinking a bit more
- Capture more emotional or motivational detail
- Cut down on re-contacting people later
- Save time during analysis because the data’s already richer
It’s like giving your open-ended questions a second chance and respondents often do have more to say when asked.
It’s Not One-Size-Fits-All, And That’s a Good Thing
One of the biggest perks? You can decide how the AI behaves. You don’t have to let it run wild.
For example, you can:
- Give the AI context on your survey’s purpose so it knows what kind of insights you’re after, whether it’s understanding sentiment, uncovering motivations, or exploring unmet needs.
- Decide whether the AI should guide responses, maybe by suggesting likely directions or clarifying the question when people seem unsure. This can help bring focus without leading too strongly.
- Choose whether to probe disengaged respondents, sometimes a short or indifferent response isn’t worth digging into, and that’s okay. You can set the system to skip probing in those cases.
- Set a cap on follow-up questions, typically one or two is enough. You want to keep the flow natural, not turn the survey into an interrogation.
In other words, it’s not about handing over the reins. It’s about fine-tuning how you ask for more, in a way that works for your audience.
The Human Side of This Tech
Here’s something worth thinking about: just because it’s AI doesn’t mean it should feel like AI.
Good probing should feel natural, not robotic. It should match the tone of the survey. It shouldn’t sound like a chatbot trying too hard to make small talk. And respondents deserve to know what’s going on. A quick message like “You might see a follow-up based on your answer” can go a long way in building trust. No tricks, no confusion.
Also, keep privacy in mind, especially when dealing with sensitive topics. Anonymity and a respectful tone are non-negotiables.
Not Sure Where to Start? Try This.
You don’t need to roll it out across your entire survey right away. A smart move is to test it on one or two questions where the details really matter.
See how people respond. Watch for drop-offs. Look at how much richer the answers get. You’ll likely spot the value pretty quickly.
Over time, you can refine it, maybe even use it in places you hadn’t considered, like employee feedback or brand perception studies.
Looking Ahead: It’s Only Getting Smarter
AI probing is still early in its journey. But even now, it’s reshaping how researchers gather open-text feedback. No more settling for one-line answers. No more guessing what people meant.
Down the line, we’ll probably see more emotion-aware probing, better language support, and smoother integration into other research tools.
For now, though? It’s a simple, effective way to level up your survey without adding more questions or more work.
Final Take
Better responses start with better questions. But sometimes, one question just isn’t enough. That’s where AI probing earns its place. It’s not about replacing researchers or automating everything. It’s about helping people tell you what they really think, in their own words, with just a little extra encouragement.
And if that leads to more useful insights! That’s a win for everyone.
If you're curious about how AI probing could fit into your research workflow or you're ready to start experimenting with it, we’re here to help. If you're a client, reach out to your account manager to explore setup options, customization features, and best practices tailored to your needs. If you're new to Voxco, and would like to learn more, book a demo now.
Read more

The Latest in Market Research
Why AI is Your Secret Weapon for a Thriving Market Research Career
I’ve spent over two decades building technology companies. Before that I started my career in research and so building technology for researchers has brought me full circle. I’ve seen firsthand how big tech shifts can cause fear but also open new doors. AI’s impact on market research from 2023 to 2025 is profound: it’s changing workflows, roles, and outcomes. But here’s the truth—AI isn’t here to replace you. It’s here to empower you. Think of it as an experienced instructor standing next to you as you work and pointing the finger at what is important and better ways to do things.
I’m the CEO of Voxco, a leader in survey and text analytics technology, working at the frontline where AI meets market research. This isn’t speculation—it’s real change unfolding in companies I work with daily. I’m sharing what I’ve learned to help you thrive in this new landscape.
The Collapse of Traditional Roles Is Happening — and It’s a Good Thing
From survey designers and data analysts to insight strategists, AI tools are combining many tasks into one streamlined process. This shift means:
- Surveys that once took days to program are made efficiently with AI, reducing human hours.
- AI chatbots can now conduct interviews and focus groups, cutting down on the need for human moderators.
- Data analysis that required weeks is now done in minutes with natural language processing and automated significance testing.
- Once feared for their complexity and cost, open-ended questions now flourish—empowered by AI’s ability to summarize, categorize, and scale understanding.
- Automated reports with narrative insights and recommendations come out in seconds, not days.
One perspective is that this consolidation is a bad thing for workers, another is that this is a blurring of roles that brings more productivity to our field. Some people will come out of this with vastly more value to their customers and the market. Those are the people that learn to work through these blurred lines of roles. Shifting your focus from lower level to higher-value analysis and strategy could make you even more valuable to your organization or team.

The Current Market Shift and What That Means for You
We’re already seeing a fundamental shift in both the fabric of how we conduct research and the speed at which we analyze data. Take a look behind the curtain:
- Screen Engine uses AI to analyze moviegoer feedback in near real-time, enabling studios to tweak marketing and editing quickly before release—saving money and improving results.
- Ascribe AI automatically generates rich reports from open-ended survey data, combining qualitative and quantitative themes in seconds.
- A Wisconsin School of Business study found generative AI can deliver qualitative insights comparable to seasoned human analysts, speeding up deep thematic analysis.
But the shift isn’t just at the study level; both teams and organizations are seeing large scale change:
- AI reduces routine survey and data work by over 90% in some cases.
- According to University of Leeds research, AI could improve business efficiency and cut costs by 30% by 2035 in data-heavy roles.
- McKinsey reports firms using AI analytics have 20% higher productivity and innovate 30% faster.
If you’re feeling a seismic change reverberating beneath your feet, take heart. Although traditional junior roles like survey programmers and entry-level analysts are shrinking, there is an opportunity here to own the future if you are willing to evolve. Being of value and rising to the challenge won’t rest on manual data crunching. If you’ve already shifted focus to AI oversight, interpretation, and ethical insight generation, you’ve won 80% of this change already.
Here’s Your Market Research Career Roadmap in the AI Era
Given these changes, it’s smart to lay out a plan for how you might create extraordinary momentum in your marketability in a matter of years. If you can see the terrain changing, why not build a perfectly adapted vehicle to take you toward the horizon?
Step 1: Master AI Tools & Interpretation
This is your time to get acquainted with the landscape and familiarize yourself with the newly available tools. Getting your tools to a point of being ready for projects, means using them right away:
- Starting from scratch? That’s fine. Start using 2-3 LLMs (ChatGPT, Claude, etc) as a thought partner in your research.
- The more you teach the models about who you are, what you do and refine the rules of working with you, the more you will get out of them. It is like a friendship in a way; being authentic and open leads to better results.
- Now you are ready to use the tools in your projects for AI output quality and spotting errors.
- Try some of the coding open-ended response analysis and sentiment detection tools.
- The most important part of Step 1 is to just get started. Experiment. Failures lead to learning.
Step 2: Become an AI-Augmented Researcher, Blurring the Lines of Traditional Roles
After Step 1, you’re in the trenches and you know what’s available and how it performs. You’re becoming a master at coaxing insight out of AI. As you gain momentum, you might:
- Guide AI in custom insight generation.
- Develop expertise in integrating AI findings with business context.
- Hone storytelling skills to translate data into strategy.

Step 3: Lead AI-Driven Insight Strategy, Changing Your Whole Business
This is your time to mentor others and to start to lead out the discussion of where market research can and should go next with AI-augmented research. Asking questions about what limitations are removed by your new efficiency will lead to whole new strategies. Strategic moves might be to:
- Change how you work with customers on projects - how much more data can be provided for projects such as product launches, pricing analysis, sentiment analysis at the same budget they have had before? What better decisions will your customer make and what better outcomes will they have with this added analysis you can provide?
- How can you measure a ‘before’ state of traditional market research, and this changed model you have built? How can you use that to win new customers or expand work in the ones you already have?
- Can you build a new flexible model for how work gets done in your firm? Shape ethical guidelines and quality standards for AI research use.
- Mentor junior analysts to adopt AI fluency and this new model.
Step 4+: Innovate & Influence
This is what you’ve been building toward - ones where your thought leadership is valued because you’ve been in the trenches, know the tools and can see how AI-augmented research functions across platforms. You might:
- Pioneer new AI-driven research methods and platforms.
- Advise leadership on AI’s impact on market and customer understanding.
- Build cross-functional teams that leverage AI for continuous decision-making.
You’re In the Driver’s Seat if You Can Adapt
Yes, some roles are already diminishing to partial roles, but getting current with new tools and skills will accelerate you to the top of the list for newly created roles that will inevitably follow. Imagine a world where analysts become insight orchestrators, survey programmers become research program designers and all research professionals provide far more insights than ever before.
Goldman Sachs estimates 18% of jobs globally could be automated by AI—but many market research roles are evolving, not vanishing. It's time for reimagining and adaptation.
The Big Picture & Final Thoughts - Think with Abundance
AI is pushing down the cost of research dramatically and speeding up insight cycles by factors of 10 or more. This is deflationary—it means research becomes cheaper and more accessible, benefiting businesses and consumers alike. Stop imagining a world with the same amount of data for a lower price and start imagining a world with far more data within shorter time periods - this thinking with abundance will lead to better outcomes for your customers’ outcomes, your team’s success and the market’s growth. At the same time, faster, richer insights drive innovation and economic growth. Per Brad Gerstner, AI-driven productivity gains are expected to add $10 trillion of global productivity per year over the next several years, which is an almost unfathomable change to our world and is almost completely driven inside knowledge work - like Market Research.
The AI revolution in market research is real, but it’s not a threat if you are game to adapt—it’s the biggest opportunity of your career. Those who harness AI’s power will accelerate their careers, deliver better insights, and help their companies innovate faster. Be the researcher who partners with AI, not the one replaced by it - that is only the beginning, the real win is to be part of the elite team of researchers that drives our market to a place of abundance.
And remember, it’s not about owning the machine; it’s about knowing how it works. When word processers came along, just like AI today, they were there to stay and get only better with time. Word processors did not replace writers—they amplified them. In the same way, AI doesn’t replace thinking; it rewards those who think clearly and know how to ask the right questions.
If you want to dive deeper, I’m always open to sharing what I’ve seen at Voxco and across the industry. Together, we can turn AI from a fear factor into a career accelerator. Click here to connect with me on LinkedIn.
Read more

Text Analytics & AI
How to Choose the Right Solution
Accelerating Insights: Ascribe Featured in Quirk’s Innovative Products & Services
Open-ended comments offer depth, but turning them into usable insights has long been a challenge. The feature article in Quirk’s, “Accelerate insights! Simplify analytics with Ascribe,” dives into how Ascribe’s AI-driven solutions are making open end analysis easy. Whether coding survey responses or processing customer feedback from websites and social media, Ascribe’s AI-powered tools—Theme Extractor, Ask Ascribe, and Visualizations—deliver better text analysis results with minimal manual effort, up to 90% faster. Ascribe enables the user to control the level of automation, select when to use Generative AI, and edit the results.
Ascribe Innovations Accelerate Open-End Analysis
Theme Extractor Delivers Precision Results at Unparalleled Speed!
At the heart of Ascribe’s innovations is Theme Extractor, its proprietary text analysis processor which uses advanced AI and Natural Language Processing to instantly identify the most important themes in open-ended data for topic, sentiment and emotion analysis. It generates a human-like codebook with well-structured nets and multi-level netting, and descriptive theme-based codes. Then, Theme Extractor automatically analyses over 95% of open-end responses with exceptional accuracy and reliability. Theme Extractor can also process studies with multi-lingual responses, no problem: simply choose your desired language for the results. No taxonomies, rule sets or training examples needed. And, codebooks can be saved for future use.

Ask Ascribe Lets you Interview your Data. Just Ask!
Ask Ascribe lets you ask a question of your dataset and based on the analysis of your data it immediately answers the question, providing insights, summaries and reports. Whether identifying key themes, exploring customer emotions or pinpointing areas for improvement, Ask Ascribe helps you find answers. Make deep analysis as simple as a conversation, Just Ask!

Ascribe Visualizations Instantly Reveal Valuable Insights
Ascribe doesn’t stop at just analyzing text—it transforms it into powerful, intuitive visuals. Dynamic infographics and charts highlight patterns, trends and sentiment at a glance. And you can apply filters or drill down into the comments for better understanding. Ascribe visuals help uncover powerful insights fast.

Ascribe, Designed for the Demands of Today’s Researchers
With over 25 years of experience, Ascribe continues to innovate to deliver the best text analysis solutions from the latest AI technologies. For market researchers, CX professionals and corporate analysts, Ascribe's AI tools simplify workflows, improve productivity, accelerate insights and drive better decisions – faster.
Ready to Simplify Your Text Analytics?
Ascribe’s AI-powered innovations are built into Ascribe Coder and CX Inspector. Ready for for a free demo with your dataset? Click here to book a demo now.

Read the article on Quirk’s: Accelerate insights! Simplify analytics with Ascribe
Read more

The Latest in Market Research
Marketing Research vs. User Research: An Unnecessary Divide?
With separate associations, conferences, and certifications for marketing researchers and user experience researchers, the two are often treated as distinct disciplines. While there are some differences, are we splitting hairs and creating an unnecessary and unwelcome divide? Let’s have a look at how much marketing researchers and user researchers have in common and how we can learn from each other.
Both seek to understand human behavior
At their core, both marketing researchers and user researchers seek to understand consumer and customer behaviors and preferences to drive better quality business decision-making. Where marketing researchers are trying to understand brand and product preferences and UX researchers are trying to understand how people want to experience and interact with those products and services, the underlying questions remain the same.
What do people want, need, and struggle with? When, where, why, and how are they struggling with those things? What is the human experience and how can we understand that experience more deeply and accurately?
Both UX researchers and market researchers have a genuine interest in the human experience and want to understand people.
Both share a methodological toolbox
Whether you have a personal preference for qualitative or quantitative techniques, marketing researchers and user researchers pull from the same toolbox overflowing with qualitative, quantitative, experimental, and correlational techniques. For example:
- Quantitative surveys: Both market researchers and UX researchers rely heavily on surveys. The quantitative data gathered from surveys helps both groups gather standardized data to describe differences among groups in unbiased ways and track trends over time. Surveys are an excellent way to quantify perspectives of both user experiences and brand perceptions.
- Interviews and focus groups: Focus groups and interviews are also heavily used by both types of researchers. Often, the best way to understand concerns and problems is to have a personal conversation with a researcher who is trained in thoughtful probing. Whether the thing being discussed is the UX of a website or product package, or the strengths and weaknesses of a TV commercial or a community program, inviting people to talk through their perceptions with a researcher, whether online or face to face, elicits deep and very personal insights.
- A/B and Test/Control designs: Whether it’s called A/B testing or Test/Control research, at the heart of much research is experimental design. The direct and controlled comparison of one group to another group can help us to understand which user experience or brand personality is preferred.
The same goes for shop-alongs, analytics, biometrics, bulletin-boards, AI/chatbot interviewing, and a host of other research techniques. All are well-loved and well-used by both marketing and user researchers.
Divergent goals and scope
So far, marketing and UX research have a lot in common. The key difference, however, lies in their goals and where their expertise is applied in the lifecycle of a product or service.
Marketing researchers embrace a broad range of goals over the entire product lifecycle. From pre-development innovations to pricing, customer experience, customer journeys, and market opportunities, their outputs are used extensively by brand managers, business strategists, and sales teams to solve a wide range of business problems.
On the other hand, user researchers have more narrow goals that focus on one aspect of the product lifecycle. Specifically, they seek to understand how people experience and interact with products and services, insights that are used not only by brand managers, business strategists, and sales teams, but also by product designers and engineers.
Marketing researchers address a wide range of objectives including UX research whereas UX researchers specialize in and have extensive experience in only UX research.
What can marketing researchers learn from user researchers?
Whether we’re marketing or user researchers, all researchers have generalist skills. We’re familiar with the pros and cons of questionnaire, focus group, interview, bulletin-board, shop-along, and analytics research tools. We’re familiar with considerations related to ethics, privacy, culture, and community nuances. We may not know the intricate details of every aspect but we know enough to advise research buyers on which technique would best suit their purposes and how to choose the best supplier to meet their needs.
Similarly, most researchers have specialist skills, expertise, and preferences. UX researchers love figuring out, understanding, and improving the user experience. Similarly, some marketing researchers love creating personal connections with consumers via focus groups and interviews while others love pricing research and the fun that goes along with conjoint analysis, Van Westendorp’s Price Sensitivity Meter, and the Gabor-Granger technique.
Perhaps the key difference between marketing researchers and UX researchers is that user researchers have whole-heartedly embraced being specialist researchers with niche skills. Is it time for marketing researchers to take this as a cue? Many of us aren’t generalist qualitative researchers or quantitative researchers. We’re brand equity researchers, pricing researchers, packaging researchers, or persona researchers.
Depending on our unique passions, we too could champion and identify ourselves in these ways. Just as brand managers always know who to turn to when they need UX research, let’s help them know who to turn to when they need journey mapping research, package testing research, or ad testing research. We might even encourage our research associations to develop subject matter certifications for pricing researchers, brand equity researchers, and loyalty researchers.
For those of you who are already specialist researchers or who have chosen a path to become experts in online surveys, CATI, or qualitative coding, please get in touch with one of our experts. We’d love to be part of your expert team!
Read more

How to Choose the Right Solution
How a Global Beauty Retailer Used In-House Research to Stay Ahead in a $600B Market
In beauty and personal care, yesterday’s trend can become today’s shelf-warmer. To stay ahead, one global retailer—operating across 35+ countries—decided to rethink how they collected and used customer insight.
Instead of chasing trends, they built a system to lead them.
The Challenge: When the Market Won’t Wait
The global beauty market hit $446B in 2023—and it’s still growing. Competing in this space requires more than great products. It requires real-time understanding of what customers want, how they shop, and what drives them to return.
This brand knew they needed to move faster, test smarter, and act with confidence. That meant bringing research in-house—with the right tools to back them up.
The Strategy: Make Insight Part of Every Decision
With the right tools, the brand was able to build an agile research system that supported smarter, faster decisions across the business.
Key pillars of the strategy:
- Comprehensive product and service testing
Every new concept—from skincare lines to loyalty features—was tested for appeal and purchase potential before launch using Voxco’s survey tools. Only the most promising ideas made it to market.
- Custom-built brand indicators
The team developed internal barometers—like a proprietary “attractive brand” score—to track performance and customer sentiment over time.
- Real-time access across teams
Insights didn’t sit in dashboards—they were shared across departments to inform marketing, merchandising, and operations in real time.
The Results: Scalable, Cost-Efficient Research That Delivers
By managing consumer research internally with Voxco, the retailer gained three core advantages:
- Agility
Surveys could be designed, launched, and iterated quickly—helping the brand respond to shifting trends without delay.
- Cost-efficiency at scale
In-house execution meant more research could be done, more often, without the overhead of outsourcing.
- Trustworthy, decision-ready data
With direct control over survey design and data quality, every insight was dependable—and immediately usable.
The Ripple Effect: Insight That Powers the Whole Business
The benefits extended far beyond product teams. Inventory managers used trend data to optimize stock levels. Store operators improved frontline service with customer experience feedback. Brand managers refined campaigns based on real-time sentiment.
Want to learn how you can build a scalable, insight-led strategy that drives decisions across teams? Book a demo with Voxco to see it in action.
Read more

The Latest in Market Research
Text Analytics & AI
Why Coders in Market Research Shouldn’t Fear AI
If you work in market research coding—specifically with open-ended responses—you’ve likely heard the chatter: “AI can do it now.” With the rise of tools that can automatically classify free-text comments, summarize themes, and even simulate human responses, it's easy to worry that your role might be on the chopping block.
But here’s the reality: while AI is changing how open-ended coding is done, it’s not replacing the need for skilled human coders. In fact, your expertise is more important than ever.
Let’s talk about why.
1. AI Still Needs Human Oversight
Yes, AI can classify open-ended comments, but it’s far from perfect. It misses nuance, struggles with sarcasm, fails to understand context, and often makes inconsistent calls. If you’ve ever audited machine-coded responses, you know: it still takes a human eye to ensure quality.
Human coders bring judgment—a sense of tone, relevance, and deeper meaning—that AI just can’t replicate reliably.
2. Category Schemes Don’t Build Themselves
Before any AI can classify text, someone needs to define the coding frame—the categories, definitions, and boundaries for what goes where. And when the data shifts (new product, new market, new audience), that structure needs adjusting.
Creating and refining these frameworks is a creative and analytical task. It takes market knowledge, business understanding, and the ability to connect dots between consumer language and client objectives. That’s your domain.
3. Clients Still Care About the "Why"
Clients don’t just want a dashboard of tags. They want to understand what people mean, how they feel, and what drives their behavior. Open-ended responses are where that gold lives. AI can help speed things up—but humans are still needed to interpret, synthesize, and communicate insights.
What does “It just feels cheap” really mean in a brand perception study? Is it about price, quality, packaging, or social status? That kind of insight doesn’t come from a model—it comes from you.
4. Edge Cases Matter More Than You Think
In market research, it’s often the outliers—the odd comments, unexpected complaints, or surprising sentiments—that lead to meaningful discoveries. AI tends to smooth those over or misfile them entirely. Human coders spot the oddities, dig deeper, and surface insights that algorithms overlook.
You're not just categorizing data. You're finding what matters.
5. You’re Becoming a Strategist, Not Just a Coder
The role of a coder is evolving. It’s moving from manual labeling to quality control, code-frame design, model training, and insight generation. This is good news: it means your work is becoming more strategic, not less.
If you're adapting and learning how to work with AI—auditing its output, guiding its accuracy, and integrating it into your workflow—you’re positioning yourself as a core part of the insights process, not a casualty of automation.
Final Thoughts
The future of open-ended coding isn’t about choosing between humans and machines—it’s about combining strengths. AI can handle the bulk; you bring the brain.
So no, your job isn’t disappearing. It’s evolving. And if you’ve built your skills around critical thinking, pattern recognition, and insight generation, you’re not just safe—you’re essential.
Read more

Market Research 101
The Latest in Market Research
Customer Metrics That Matter: From CSAT to CX to Customer Success
Customer-centric strategies are critical drivers of long-term business success. They drive revenue, competitive advantage, innovation, and they future-proof the business. To become customer-centric, businesses need to understand the differences and connections among three key concepts: Customer experience (CX), customer satisfaction (CSAT), and customer success.
Customer Satisfaction (CSAT) as a Discrete Experience
The last time you purchased something, you followed a process of visiting one or more physical or digital retail outlets, reviewing the options, and selecting the product or service that best met your needs. In the moment, you felt some degree of satisfaction with the website you used, the employee who helped you, or the packaging you handled. This is the scenario in which measuring CSAT is most applicable – your satisfaction with the specific touchpoints you encountered on that single occasion.
Measuring customer satisfaction serves many purposes. It helps business leaders, marketers, and innovators identify pain points at specific points in the customer journey, issues with products and services requiring improvements, and gaps that can be filled by creating new products and services.
The most common research technique for measuring CSAT is the ubiquitous survey. Airport security lines and shopping mall bathrooms present digital devices with red or a green buttons to their clientele. Restaurants offer QR codes to their customers by which they can answer a couple of questions about their server. And, at the end of customer support calls, companies invite customers to press a number to rate the person they interacted with.
CSAT questions generally focus on understanding the experience immediately at hand:
- Are you satisfied or unsatisfied with the customer support you just received?
- How would you rate the quality of the service you received today?
- How easy was it to use our website?
- What could we have done better today?
CSAT can also be measured via qualitative coding and sentiment analysis of online reviews, social media comments, and customer support chats. With the help of AI, discrete qualitative comments can be quickly and easily coded into categories and themes to understand which areas drive customer satisfaction.
Customer Experience (CX) for Broad, Long-term Perceptions
Rather than focusing on a single customer touchpoint, customer experience research focuses on broader, longer-term relationships. For example, companies like Apple, Amazon, Disney, and Starbucks have earned reputations for creating painless omnichannel customer journeys. Regardless of whether people interact in-person with their customer service team, digitally through their website or apps, or physically through stores and product packaging, generations of customers have enjoyed positive experiences over multiple touchpoints and display high levels of customer loyalty and retention.
By measuring customer experience, brands can identify and resolve friction points throughout an omnichannel customer journey and improve the broader customer experience. Further, CSAT information can be used to prioritize the innovation of new products, tailor messaging for diverse target audiences, and make wise financial and strategic decisions about the business.
Because customer experience includes such a broad domain, it is often measured using a variety of quantitative questionnaires as well as qualitative interviews, focus groups, bulletin-boards, and open-end survey responses analyzed with AI. Possible questions include:
- On a scale from very satisfied to very unsatisfied, how would you rate your overall experience with us?
- On a scale from 0 to 10, how likely are you to recommend us to others? (NPS)
- Please describe your experience of working with our customer support team.
- How easy was it to start using our product?
- How intuitive is our product to use?
- What words would you use to describe our company?
- What would make you consider switching to another company?
Customer Success for Long-term Loyalty and Retention
While understanding both customer satisfaction and customer experience is critical, businesses also need to proactively prioritize customer success. Thus, instead of focusing only on delivering positive interactions, brands should work to ensure their products or services help clients achieve their long-term goals. The end result is long-term partnerships, increased customer lifetime value, and opportunities to unlock shared growth.
Because of this focus on shared growth, customer success is usually measured both quantitatively for tracking purposes and qualitatively to gather deep insights. In addition to incorporating customer satisfaction and customer experience questions, research into customer success may also include questions like:
- How well do our services help you achieve your goals?
- What kinds of tasks allow you to use our product to its full potential?
- What types of measurable value have you seen from using our services?
- How well does our customer support team provide you with the guidance you need?
- Does our team proactively help you maximize your use of our product?
- How effective was the training you received from our support team?
Integrating CX, CSAT, & Customer Success
Focusing on customer satisfaction is a quick and easy way to identify isolated weaknesses requiring resolution. However, to drive sustainable, long-term business growth, companies need to transform ad hoc customer satisfaction research projects into more comprehensive and customer experience and success programs.
With careful attention, this transformation can lead to the creation of research and activation feedback cycles that improve customer retention, cultivate brand advocates, and ultimately accelerate business growth.
The Voxco team prides itself on creating superior customer experiences and helping our partners find greater customer success. If you’d like to build a tailored customer experience and success research program, please get in touch with one of our helpful customer experience experts today!
Read more

The Latest in Market Research
Becoming a Research Consultant: Skills, Mindset & Strategic Value
One of the key differences between early and later career researchers is their approach to working with clients. Many of us start off as traditional researchers and, over time, learn to become more consultative. But understanding and growing into a consultative style early on leads to advantages for both researchers and clients.
What questions do researchers and research consultants ask?
Traditional marketing researchers tend to have a laser focus on the data. Through rigorous and systematic techniques, they gather, analyze, and present data that generates essential knowledge to answer specific business problems. They may ask and answer questions like:
- What is the most appropriate research design to measure this behavior?
- How can we reduce bias in a questionnaire studying income disparities?
- What is the relationship between age and spending behaviors?
- Which theory is better supported by the evidence?
- Does X cause Y, and if so, how does it do so?
Research consultants also gather, analyze, and present data but their focus is broader and more strategic. They strive to develop deep insights that are forward-looking, opportunity driven, and improve business outcomes. They work to provide actionable recommendations and strategic roadmaps that serve the needs of executives and business decision-makers. Consultative researchers expand their focus beyond the data to include questions like:
- What is the most effective strategy to increase sales over the next 5 years?
- Why is the business losing market share and how can we reverse this trend?
- Which of these three strategies will yield the highest ROI in the short-term vs the long-term?
- Does future-proofing our business mean expanding into a new category or a new market?
- Which strategy will improve adult literacy and numeracy more quickly?
What Skills do Researchers and Research Consultants Have?
Both traditional and consultative market researchers must master essential core competencies to be effective in their roles. Along with a foundation of strong methodological expertise, both types of researchers have a solid understanding of professional standards and ethical guidelines developed by industry associations like Insights Association, CRIC, and ESOMAR. Specific skills include:
- Designing clear and unbiased surveys and discussion guides
- Quantitative proficiency to understand how, when, and why to use CATI, questionnaires, and analytics
- Qualitative proficiency to interview people, moderate groups, and perform content and sentiment analysis
- Using data to answer business and research questions with verifiable facts
- Preparing easy to read and understand reports and dashboards
However, to excel as a research consultant, an additional set of business and stakeholder management skills is essential. As such, research consultants expand their skill sets with bolder, subjective soft skills such as:
- Challenging requests and recommending unexpected solutions
- Bridging the gap between data collection and business impact
- Shaping organizational strategy by positioning themselves as partners
- Demonstrating proactive problem-solving abilities and anticipating client needs
- Mastering storytelling and persuasion to create compelling narratives that drive action
When to be Traditional VS Consultative
Some researchers love the methodological and systemic processes of creating and digging into data. On the other hand, some researchers love transforming data into long-term business strategies. Of course, just because you fall into the first category doesn’t mean you must automatically transition into the second.
Traditional market research roles are essential for large-scale projects employing standardized methodologies within established research teams. Where structured processes and clearly defined scopes guide the work, traditional roles ensure research results are reliable and consistent. Once you realize you’re a traditional researcher at heart, you’ll see that you are the backbone of insights generation.
On the other hand, research consultants shine when insights are necessary to guide strategic initiatives, especially when working with collaborative clients and cross-functional teams. This style suits researchers who want to be personally involved in shaping business decisions with long-term impacts.
Researchers who evolve into the consultant role develop a mindset of consistently asking “so what” and “now what.” They push beyond surface-level findings and uncover the real business implications of data. They engage stakeholders during the problem-definition phase rather than just the execution stage. They craft compelling narratives that connect data points to business outcomes rather than simply presenting spreadsheets and charts. It takes deliberate practice to evolve from being a number-crunchers to a strategic advisor but it’s a highly valued skill that builds personal gratification and loyalty from clients.
Seize the moment!
As a research buyer, you probably have a lot of experience working with traditional market researchers. Indeed, they are the powerhouse behind most major research projects. However, given our increasingly global economy, leveraging research consultants as strategic partners can help bridge the gap between data and strategy leading to long-term business growth.
At Voxco, we’ve partnered with lots of companies to help them achieve success with our CATI/AVR, survey, and text analytics research tools. We’d love to also partner with you to ensure you uncover the insights that matter most to your business. Please get in touch with one of our strategic research consultants.
Read more