Mekko Chart
Mekko Chart SHARE THE ARTICLE ON Table of Contents A Marimekko Chart (or mekko graph) is like a 2D Stacked Chart. In any case, as

Find the best survey software for you!
(Along with a checklist to compare platforms)
Take a peek at our powerful survey features to design surveys that scale discoveries.
Explore Voxco
Need to map Voxco’s features & offerings? We can help!
Find the best customer experience platform
Uncover customer pain points, analyze feedback and run successful CX programs with the best CX platform for your team.

We’ve been avid users of the Voxco platform now for over 20 years. It gives us the flexibility to routinely enhance our survey toolkit and provides our clients with a more robust dataset and story to tell their clients.
Steve Male
VP Innovation & Strategic Partnerships, The Logit Group
Explore Regional Offices

Find the best survey software for you!
(Along with a checklist to compare platforms)
Take a peek at our powerful survey features to design surveys that scale discoveries.
Explore Voxco
Need to map Voxco’s features & offerings? We can help!
Find the best customer experience platform
Uncover customer pain points, analyze feedback and run successful CX programs with the best CX platform for your team.

We’ve been avid users of the Voxco platform now for over 20 years. It gives us the flexibility to routinely enhance our survey toolkit and provides our clients with a more robust dataset and story to tell their clients.
Steve Male
VP Innovation & Strategic Partnerships, The Logit Group
Explore Regional Offices

Find the best survey software for you!
(Along with a checklist to compare platforms)
Take a peek at our powerful survey features to design surveys that scale discoveries.
Explore Voxco
Need to map Voxco’s features & offerings? We can help!
Find the best customer experience platform
Uncover customer pain points, analyze feedback and run successful CX programs with the best CX platform for your team.

We’ve been avid users of the Voxco platform now for over 20 years. It gives us the flexibility to routinely enhance our survey toolkit and provides our clients with a more robust dataset and story to tell their clients.
Steve Male
VP Innovation & Strategic Partnerships, The Logit Group
Explore Regional Offices
Mekko Chart SHARE THE ARTICLE ON Table of Contents A Marimekko Chart (or mekko graph) is like a 2D Stacked Chart. In any case, as

Transformative Month Over Month Growth Strategies for Modern Enterprises Exclusive Step by Step guide to Descriptive Research Get ready to uncover the how, when, what,
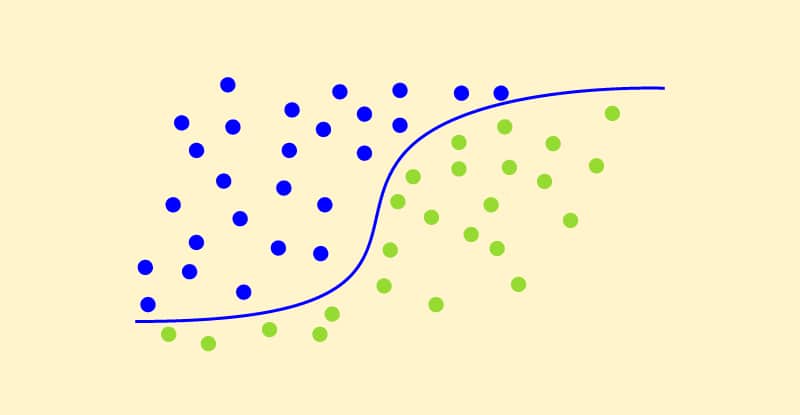
Multivariate regression: Definition, Example and steps SHARE THE ARTICLE ON Table of Contents What is multivariate regression? Most of the statistically analysed data does not
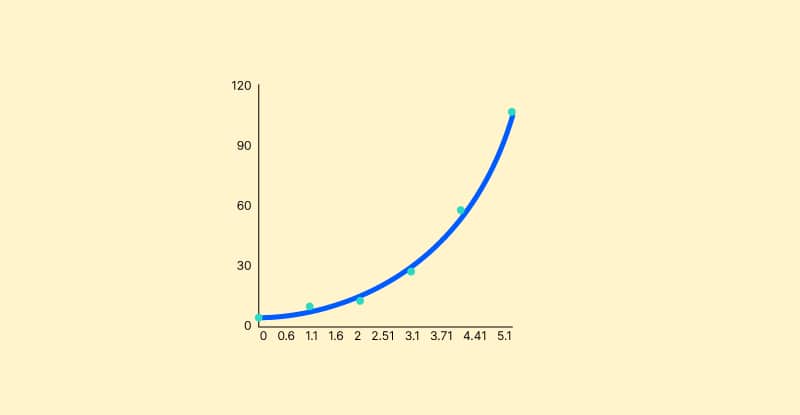
Dot Plot SHARE THE ARTICLE ON Share on facebook Share on twitter Share on linkedin Table of Contents A dot chart, also known as a
Data Munging: The Process to Clean and Prepare Data SHARE THE ARTICLE ON Table of Contents Introduction Data munging process basically helps make changes to
Gap Analysis: Definition, Types, Purposes, and Applications SHARE THE ARTICLE ON Table of Contents Definition of Gap Analysis Gap analysis is a method of performance
Bubble Chart SHARE THE ARTICLE ON Table of Contents A bubble chart is a type of data visualization in which several circles (bubbles) are shown
Correlation vs Regression SHARE THE ARTICLE ON Share on facebook Share on twitter Share on linkedin Table of Contents To start with the discussion, we
Cohort Analysis SHARE THE ARTICLE ON Table of Contents A cohort is a group of users who have a common trait across a specific time

How to Calculate Correlation Coefficient? SHARE THE ARTICLE ON Table of Contents Correlation Coefficient is used to understand and establish a relationship between variables. In
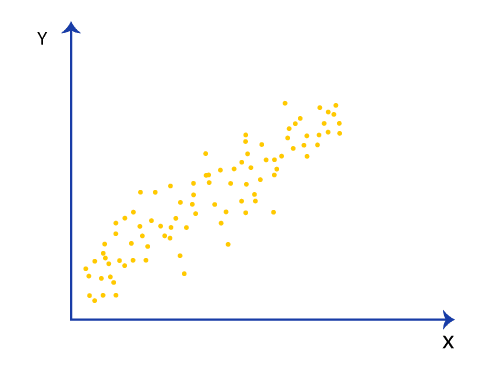
Multiple Linear Regression SHARE THE ARTICLE ON Table of Contents Introduction Before we can delve into understanding multiple linear regression, let’s first understand the concept

Least squares regression: Definition, Calculation and example SHARE THE ARTICLE ON Table of Contents What is least square regression? Let’s say we have plotted some

Factor Analysis Voxco is trusted by 450+ Global Brands in 40+ countries See what question types are possible with a sample survey! Try a Sample

Analysis Of Variance SHARE THE ARTICLE ON Share on facebook Share on twitter Share on linkedin Table of Contents Analysis of variance (ANOVA) is a

What is Causation? SHARE THE ARTICLE ON Share on facebook Share on twitter Share on linkedin Table of Contents What is Causation? Causation implies a

Correlation Coefficient Formula SHARE THE ARTICLE ON Table of Contents What is a Correlation Coefficient? A correlation coefficient is a statistical measure of the strength

Distinguishing Linear Regression from Logistic Regression Get a 15-min Free consultation with our experts. Book a Demo SHARE THE ARTICLE ON Table of Contents Machine
From Basics to Brilliance: Insights into Logistic Regression Assumptions SHARE THE ARTICLE ON Table of Contents Logistic regression has proven to be an effective way
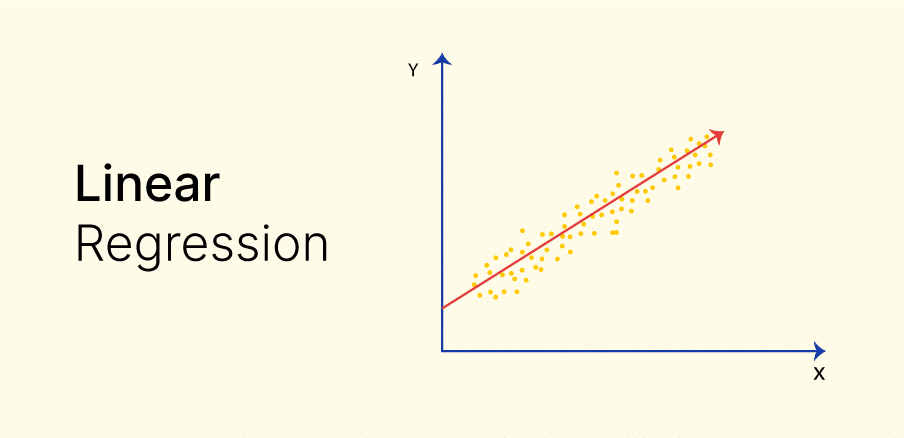
How can you calculate Linear Regression? SHARE THE ARTICLE ON Table of Contents Linear Regression is a form of statistical approach, allegedly invented by Carl

Correlation Coefficient: The Key to Variable Insights SHARE THE ARTICLE ON Table of Contents What is a Correlation Coefficient (r)? A correlation coefficient (r) is
We use cookies in our website to give you the best browsing experience and to tailor advertising. By continuing to use our website, you give us consent to the use of cookies. Read More
| Name | Domain | Purpose | Expiry | Type |
|---|---|---|---|---|
| hubspotutk | www.voxco.com | HubSpot functional cookie. | 1 year | HTTP |
| lhc_dir_locale | amplifyreach.com | --- | 52 years | --- |
| lhc_dirclass | amplifyreach.com | --- | 52 years | --- |
| Name | Domain | Purpose | Expiry | Type |
|---|---|---|---|---|
| _fbp | www.voxco.com | Facebook Pixel advertising first-party cookie | 3 months | HTTP |
| __hstc | www.voxco.com | Hubspot marketing platform cookie. | 1 year | HTTP |
| __hssrc | www.voxco.com | Hubspot marketing platform cookie. | 52 years | HTTP |
| __hssc | www.voxco.com | Hubspot marketing platform cookie. | Session | HTTP |
| Name | Domain | Purpose | Expiry | Type |
|---|---|---|---|---|
| _gid | www.voxco.com | Google Universal Analytics short-time unique user tracking identifier. | 1 days | HTTP |
| MUID | bing.com | Microsoft User Identifier tracking cookie used by Bing Ads. | 1 year | HTTP |
| MR | bat.bing.com | Microsoft User Identifier tracking cookie used by Bing Ads. | 7 days | HTTP |
| IDE | doubleclick.net | Google advertising cookie used for user tracking and ad targeting purposes. | 2 years | HTTP |
| _vwo_uuid_v2 | www.voxco.com | Generic Visual Website Optimizer (VWO) user tracking cookie. | 1 year | HTTP |
| _vis_opt_s | www.voxco.com | Generic Visual Website Optimizer (VWO) user tracking cookie that detects if the user is new or returning to a particular campaign. | 3 months | HTTP |
| _vis_opt_test_cookie | www.voxco.com | A session (temporary) cookie used by Generic Visual Website Optimizer (VWO) to detect if the cookies are enabled on the browser of the user or not. | 52 years | HTTP |
| _ga | www.voxco.com | Google Universal Analytics long-time unique user tracking identifier. | 2 years | HTTP |
| _uetsid | www.voxco.com | Microsoft Bing Ads Universal Event Tracking (UET) tracking cookie. | 1 days | HTTP |
| vuid | vimeo.com | Vimeo tracking cookie | 2 years | HTTP |
| Name | Domain | Purpose | Expiry | Type |
|---|---|---|---|---|
| __cf_bm | hubspot.com | Generic CloudFlare functional cookie. | Session | HTTP |
| Name | Domain | Purpose | Expiry | Type |
|---|---|---|---|---|
| _gcl_au | www.voxco.com | --- | 3 months | --- |
| _gat_gtag_UA_3262734_1 | www.voxco.com | --- | Session | --- |
| _clck | www.voxco.com | --- | 1 year | --- |
| _ga_HNFQQ528PZ | www.voxco.com | --- | 2 years | --- |
| _clsk | www.voxco.com | --- | 1 days | --- |
| visitor_id18452 | pardot.com | --- | 10 years | --- |
| visitor_id18452-hash | pardot.com | --- | 10 years | --- |
| lpv18452 | pi.pardot.com | --- | Session | --- |
| lhc_per | www.voxco.com | --- | 6 months | --- |
| _uetvid | www.voxco.com | --- | 1 year | --- |