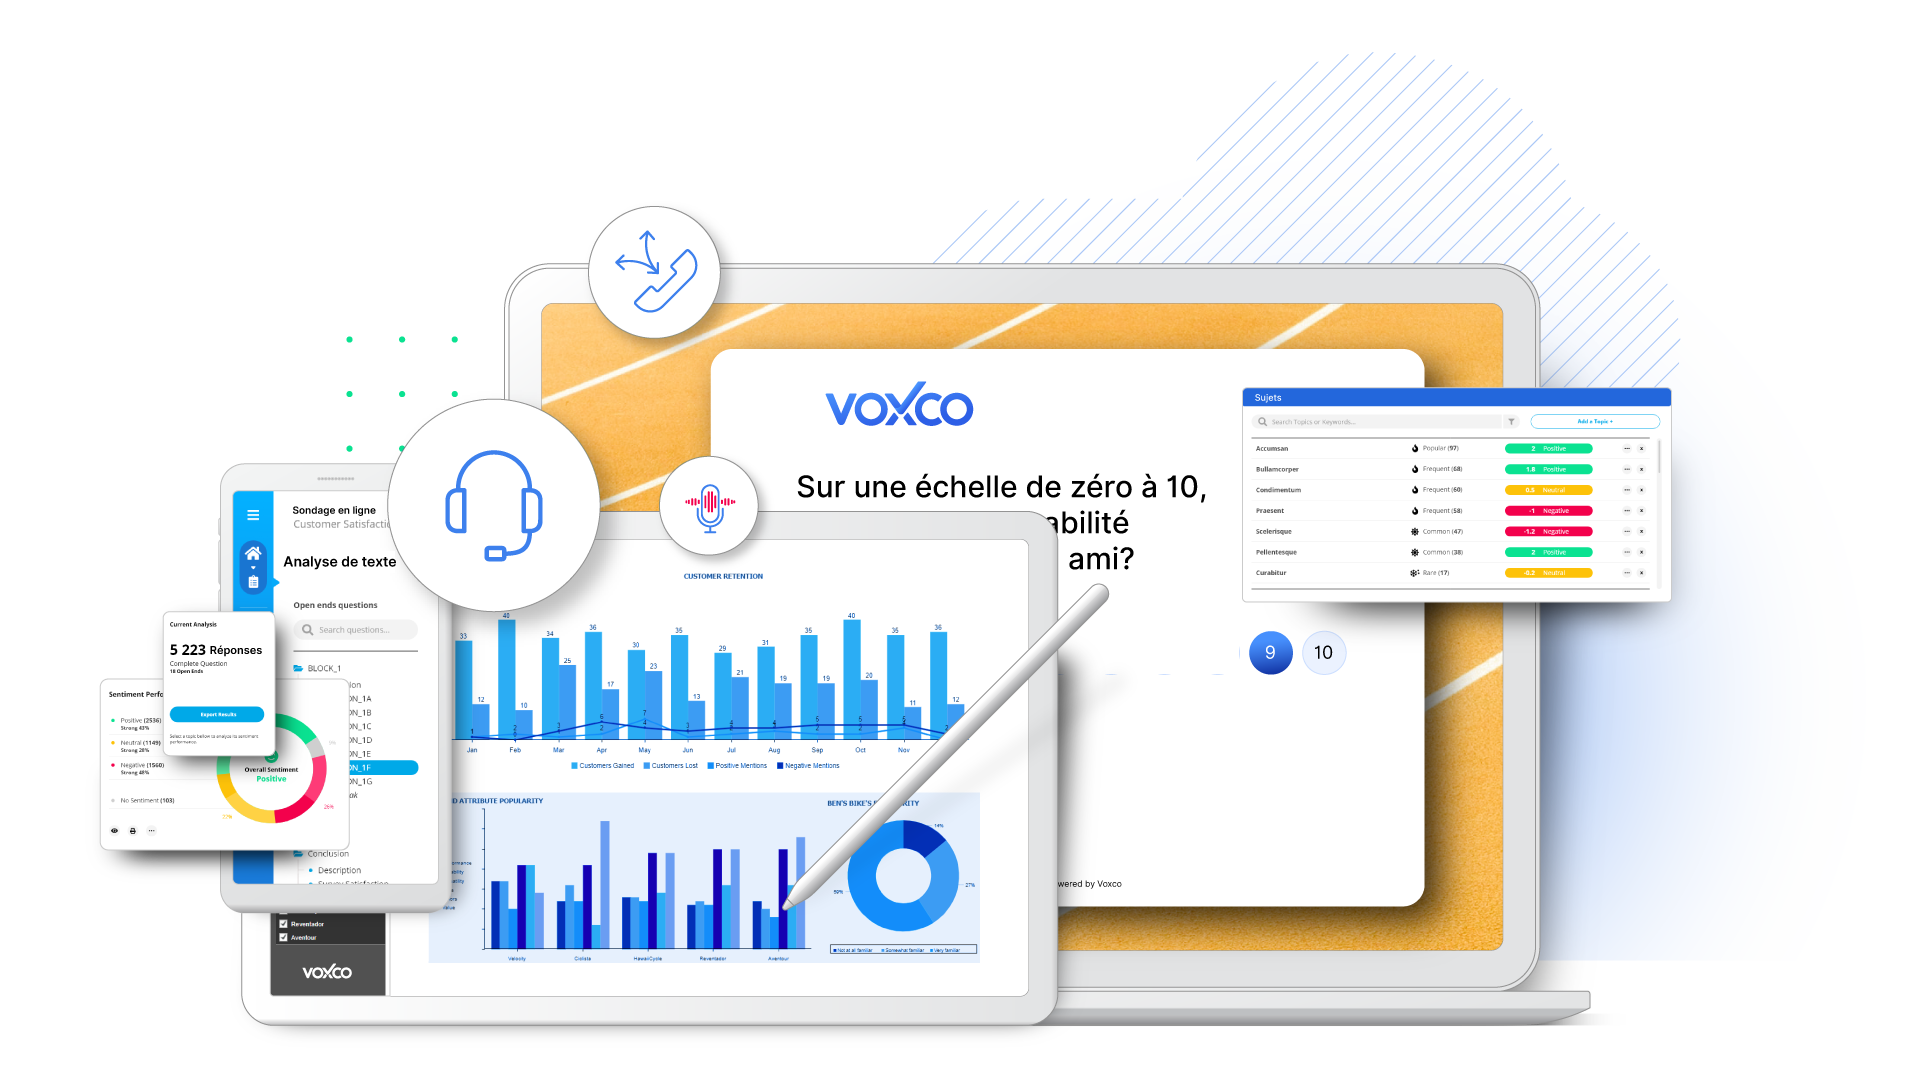
Le logiciel d’analyse d’enquêtes de Voxco peut aider les chercheurs à transformer facilement les données des enquêtes en informations exploitables ! Créez des tableaux croisés et construisez des histoires visuelles saisissantes avec Voxco Analytics. Des tableaux de bord intuitifs vous permettent d’aborder facilement des études, des enquêtes ad hoc ou des recherches syndiquées.
Depuis 1976, les 50 plus grands instituts d’études, marques mondiales et universités, nous font confiance :
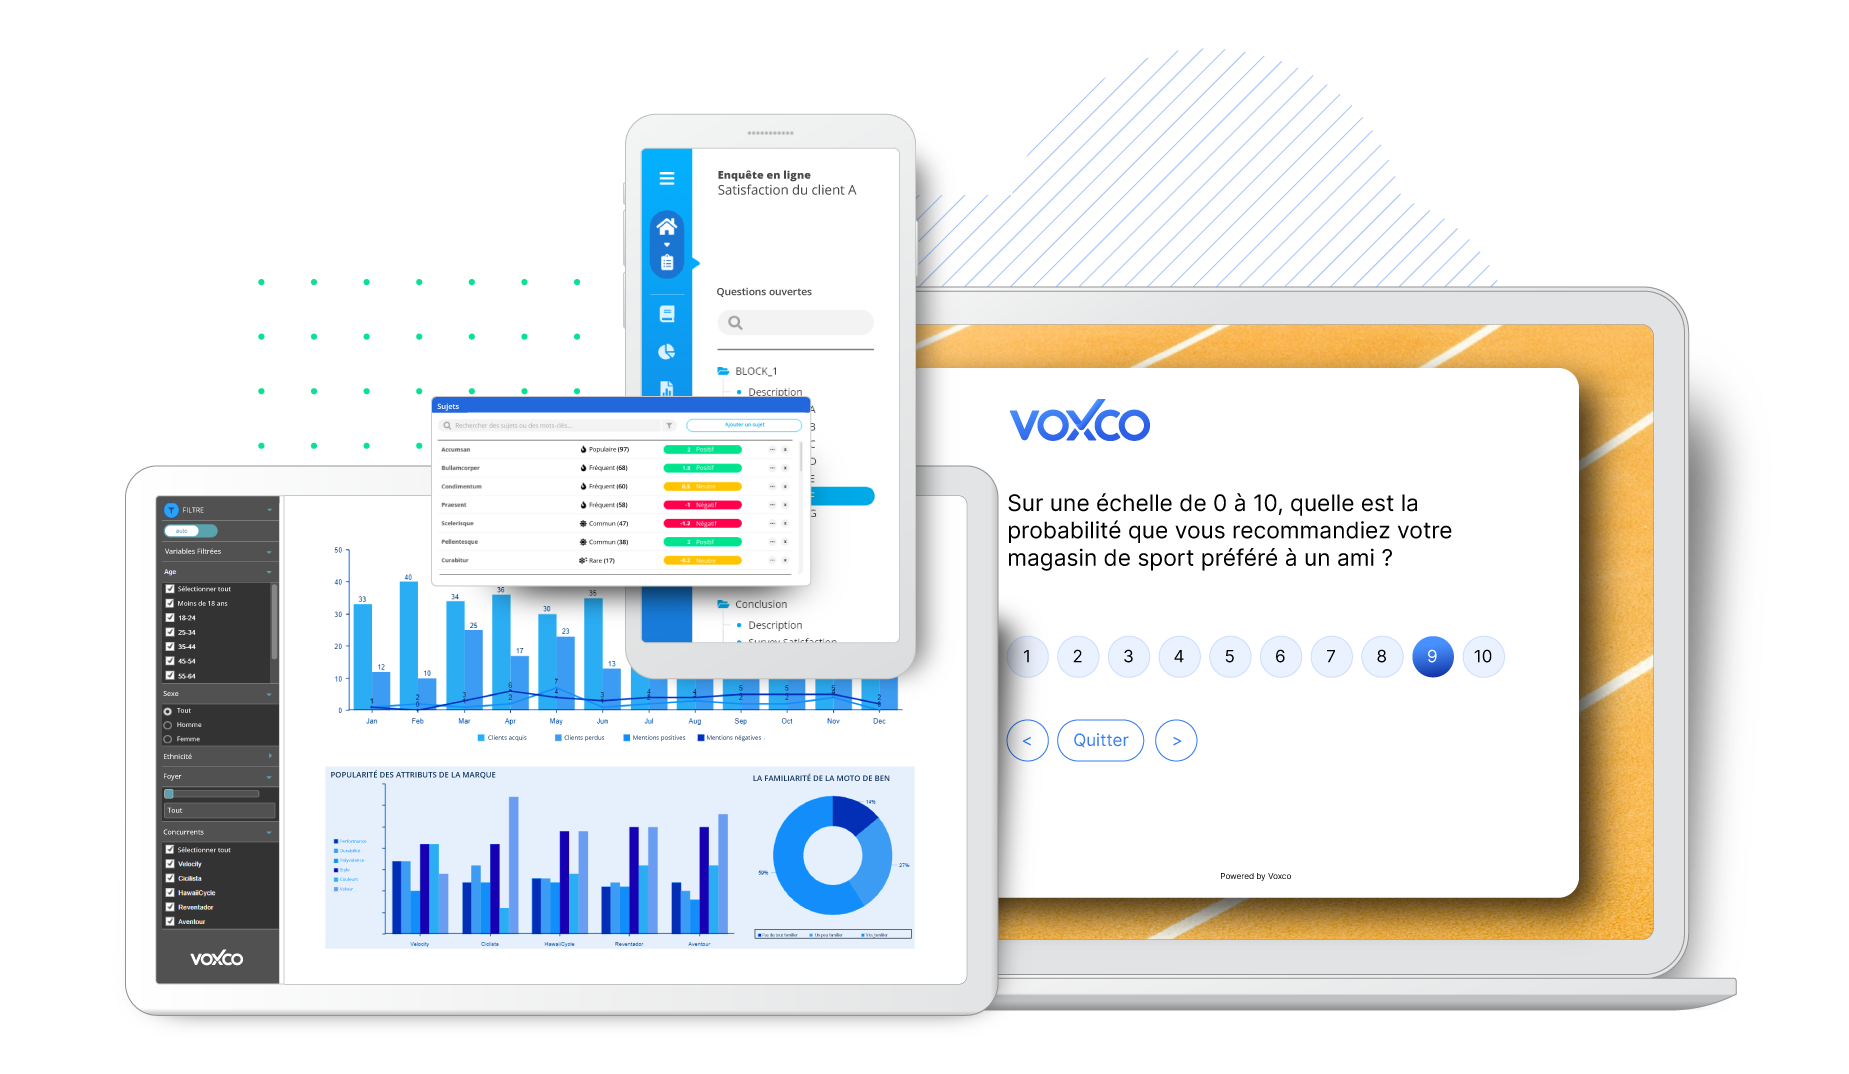
Il n’a jamais été aussi facile de transformer vos données d’enquête en quelque chose de compréhensible. Voxco Analytics vous offre tous les outils dont vous avez besoin pour préparer vos données, créer des tableaux croisés et construire des tableaux de bord visuels et interactifs. Et vous pouvez facilement les partager avec d’autres.
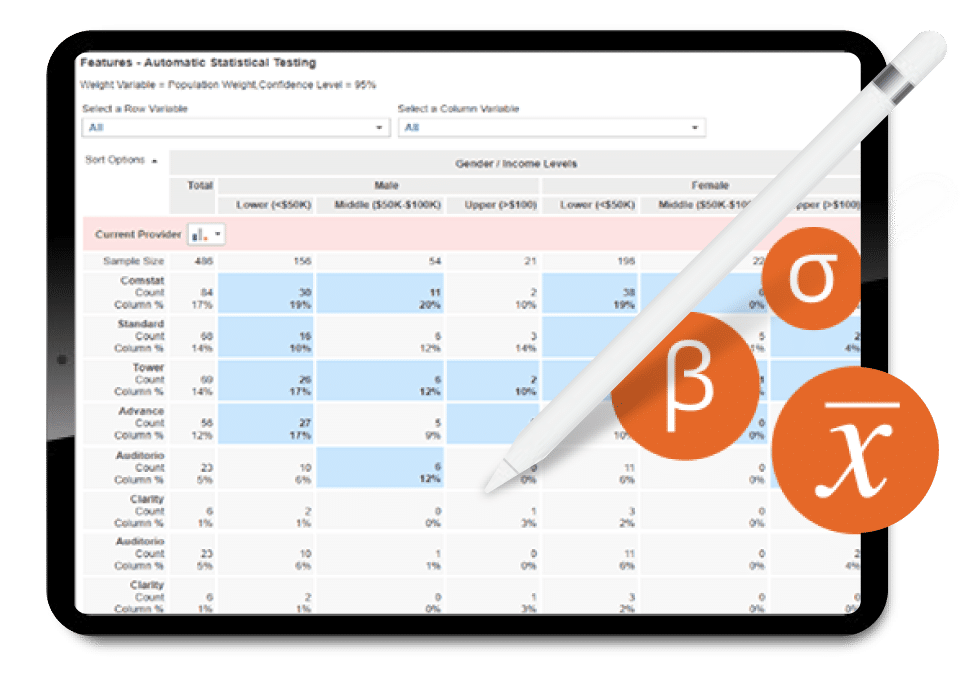
Nos puissantes fonctions de glisser-déposer vous permettent de créer rapidement n’importe quel tableau croisé, même très complexe. Ces derniers proposent des tests de significativité automatiques qui appliquent des codes couleur aux cellules dont la signification statistique est établie. Vous pouvez également effectuer des analyses statistiques avancées, gérer des variables, appliquer des pondérations et nettoyer les données des répondants.
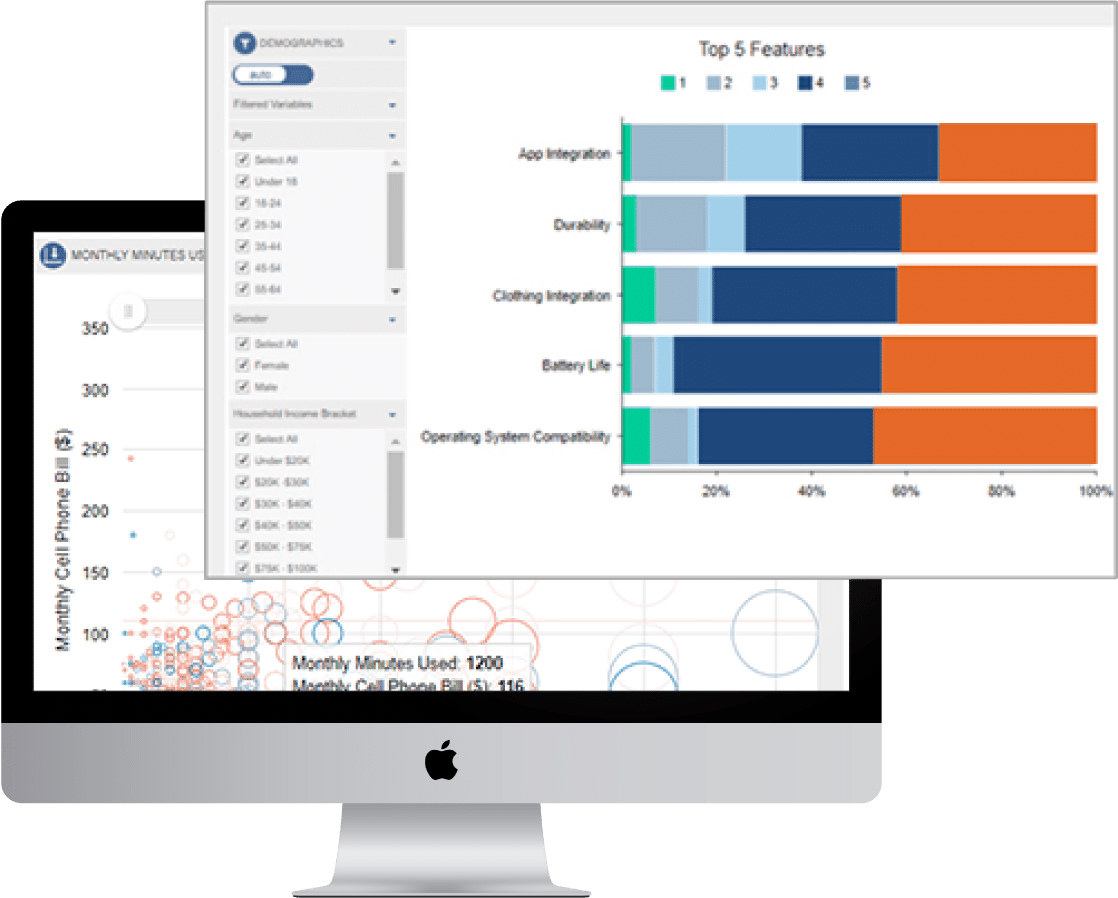
Avec notre logiciel d’analyse d’enquêtes, les tableaux croisés peuvent être transformés en graphiques visuels en un seul clic. Et vous pourriez mieux comprendre les résultats de votre enquête en appliquant des filtres dynamiques aux graphiques. Ils sont toujours à jour puisque de nouvelles données sont ajoutées en temps réel. Lorsque vous êtes prêt à les partager, il vous suffit d’exporter vers PowerPoint, sous forme d’objets natifs, ou de publier sur le portail de résultats clés.
Les tableaux de bord sont un moyen intéressant de transmettre efficacement des informations. Les utilisateurs peuvent voir instantanément les tendances et les relations entre les données. Les tableaux de bord sont idéaux pour les études à vagues, les omnibus ou toute enquête ad hoc de grande envergure. Nos tableaux de bord peuvent inclure des tableaux croisés, des graphiques, des images, des vidéos et votre propre charte graphique.
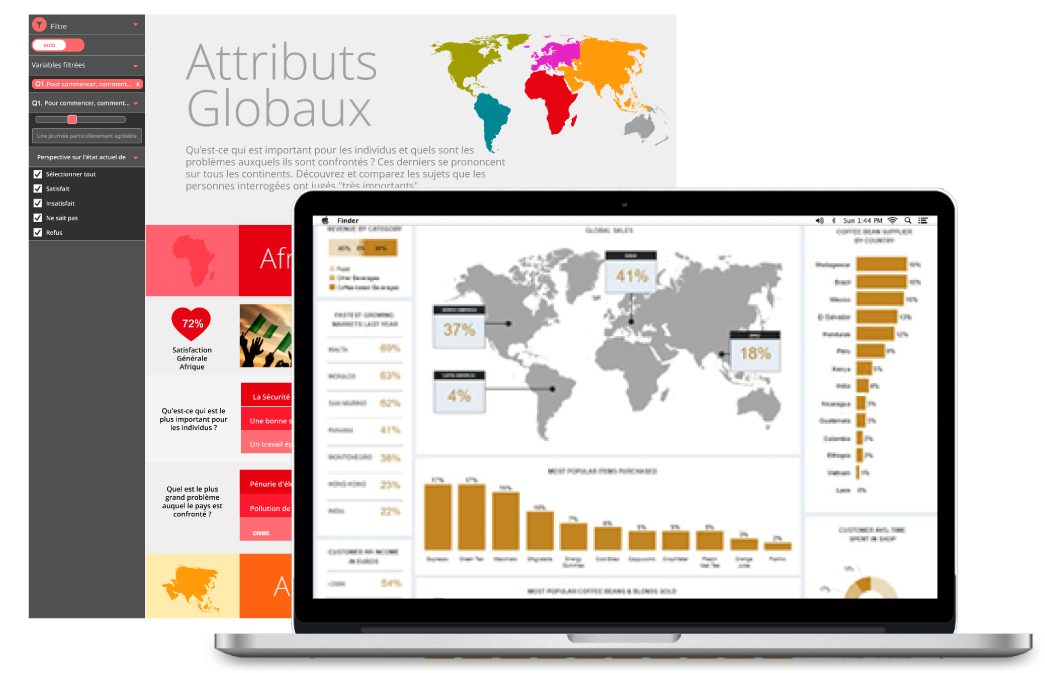

Notre système est doté d’un portail de résultats clés qui vous permet de partager en toute sécurité vos résultats les plus importants avec vos collègues et vos clients. Dans ce portail, vos utilisateurs peuvent interagir avec leurs tableaux croisés, graphiques, tableaux de bord et même exporter leurs résultats. Vous pouvez organiser vos dossiers et accorder différentes autorisations, ce qui vous donne un contrôle total sur ce que les autres peuvent voir et faire dans leur compte. La collaboration est facilitée.
Besoin de plus de détails sur les tarifs ?
Remplissez un court formulaire et notre équipe vous contactera avec les détails.

The significance of any survey software lies in its ability to transform survey collected data into meaningful and presentable inputs that can feed decision making. The survey data must be summarized and analysed in such a manner that it becomes easy even for a layman to interpret.
A good survey analytics software must be capable of translating both quantitative and qualitative information into meaningful results . This is because quantitative data can be used to understand a particular issue or topic, but the insights required to fuel the company in the right direction is obtained by how well a software is able to generate inferences by providing precise takeaways .
Further these services must be customized for the end user and should be compatible in all types of presentation formats. This offers the convenience that any organization looks for in a good survey software.
The basis of choosing the right kind of survey software is based on how well the multiple tools of research offered by a particular software can be used to achieve research objectives.
Essentially, a survey analytics platform covers all aspects of survey research including designing , distribution, collection and result analysis. The core basis of judgement , however, is the result analytics part. It includes a comprehensive set of tools that can be used by the researching party to put the collected results in manner that meets their need with respect to how they wish utilize the data.
This is the basic planning phase of a survey research where the software allows the researching party to design a questionnaire that helps them collect accurate data through a careful choice of question types and logical functions.
This is the second phase where the survey so designed gets distributed to the target participants who are deemed fit to qualify as a respondent based on whether or not they the required criteria. Survey software allows for multiple distribution options such as restricted access, selection of channels through which distribution takes place , invitation based surveys and panel management distribution to a hand picked group of qualified respondents.
The process of collection entails the consolidation of data collected on a single platform for further usage in analysis. Most survey softwares set a limit to the number of required responses beyond which no more data is required.
Advanced softwares such as Voxco provide real time participation monitoring and scheduled reporting and collection of the results to study the minute details such as screen outs , completion time and other disposition snapshots which speak to the quality of respondents as well as allow registering of major turning points and variables by adjusting reports as and when the data keeps getting added.
This is the final part of research where the organization decides whether or not they have been successful in achieving their end objective. The data so collected gets presented in manner which allows the company to use it for the desired purpose. This calls for a careful choice of tools that convert the data in the preferred manner.
Analysis of data determines the quality of the entire research process. Even if the other functions are performed properly , analysis can make or break the research. The researcher has keep in mind the stakeholders and their peculiar needs while deciding to go for a particular methodology of analysis.
Any action or follow up taken on the basis of a survey research is based on how it has been projected. For example : companies launch products after conducting pre-tests to analyse market sentiment and acceptability towards a certain product or service. Based on the information collected , companies make decisions about modifications, marketing and promotional channels, pricing , packaging, offers , incentives ,after sales services and many other concepts only for the soul purpose of improving customer experience. Each and every strategy of the company gets fuelled by how well the company has done in terms of presenting what was collected without compromising on the quality and authenticity of the data .
Further , companies stake a lot in terms of reputation, resources, time and effort just to tick the right boxes by adapting themselves to meet the expectations of the audience they serve. If these changes gets channelled in the wrong direction due to faulty analysis , misrepresentation or omission of important information, the companies can suffer hugely.
So , the importance of conducting nuanced survey analytics cannot be undermined in terms of the impact it has on market performance of companies.
Survey analytics softwares such as Voxco provides all the tools and services an organization needs allowing companies to reduce their effort and conduct their research in the way they like with all the requirements at their disposal. An organization looking to conduct a study need not jump from one site to another in search of the right tools that fit their needs.
Every research is different and one size does not fit all . Software analytics platforms allow the companies to modify their surveys to suit their personality, look and feel and appeal to their target audience in a way they know. There is no streamlining in terms of templates, question types and analytics tools which makes it the ideal choice.
Survey softwares know the right channels and audiences who can help meet the required number of responses within specified time frames. Moreover , they help access qualified respondents who have the relevant knowledge and experience to become respondents for specific topics. Thus, samples become represent the view points of the targeted segment and so the their feedback is actionable.
Information gets collected directly from the respondents. There is no scrutiny or errors as there is no need to copy or rewrite and so the data is reliable.
Nous utilisons des cookies sur notre site web pour vous offrir la meilleure expérience de navigation et pour adapter la publicité. En continuant à utiliser notre site web, vous nous donnez votre accord pour l'utilisation des cookies. Lire la suite
| prénom | Domaine | Objectif | Expiration | Type |
|---|---|---|---|---|
| hubspotutk | www.voxco.com | HubSpot functional cookie. | 1 year | HTTP |
| lhc_dir_locale | amplifyreach.com | --- | 52 years | --- |
| lhc_dirclass | amplifyreach.com | --- | 52 years | --- |
| prénom | Domaine | Objectif | Expiration | Type |
|---|---|---|---|---|
| _fbp | www.voxco.com | Facebook Pixel advertising first-party cookie | 3 months | HTTP |
| __hstc | www.voxco.com | Hubspot marketing platform cookie. | 1 year | HTTP |
| __hssrc | www.voxco.com | Hubspot marketing platform cookie. | 52 years | HTTP |
| __hssc | www.voxco.com | Hubspot marketing platform cookie. | Session | HTTP |
| prénom | Domaine | Objectif | Expiration | Type |
|---|---|---|---|---|
| _gid | www.voxco.com | Google Universal Analytics short-time unique user tracking identifier. | 1 days | HTTP |
| MUID | bing.com | Microsoft User Identifier tracking cookie used by Bing Ads. | 1 year | HTTP |
| MR | bat.bing.com | Microsoft User Identifier tracking cookie used by Bing Ads. | 7 days | HTTP |
| IDE | doubleclick.net | Google advertising cookie used for user tracking and ad targeting purposes. | 2 years | HTTP |
| _vwo_uuid_v2 | www.voxco.com | Generic Visual Website Optimizer (VWO) user tracking cookie. | 1 year | HTTP |
| _vis_opt_s | www.voxco.com | Generic Visual Website Optimizer (VWO) user tracking cookie that detects if the user is new or returning to a particular campaign. | 3 months | HTTP |
| _vis_opt_test_cookie | www.voxco.com | A session (temporary) cookie used by Generic Visual Website Optimizer (VWO) to detect if the cookies are enabled on the browser of the user or not. | 52 years | HTTP |
| _ga | www.voxco.com | Google Universal Analytics long-time unique user tracking identifier. | 2 years | HTTP |
| _uetsid | www.voxco.com | Microsoft Bing Ads Universal Event Tracking (UET) tracking cookie. | 1 days | HTTP |
| vuid | vimeo.com | Vimeo tracking cookie | 2 years | HTTP |
| prénom | Domaine | Objectif | Expiration | Type |
|---|---|---|---|---|
| __cf_bm | hubspot.com | Generic CloudFlare functional cookie. | Session | HTTP |
| prénom | Domaine | Objectif | Expiration | Type |
|---|---|---|---|---|
| _gcl_au | www.voxco.com | --- | 3 months | --- |
| _gat_gtag_UA_3262734_1 | www.voxco.com | --- | Session | --- |
| _clck | www.voxco.com | --- | 1 year | --- |
| _ga_HNFQQ528PZ | www.voxco.com | --- | 2 years | --- |
| _clsk | www.voxco.com | --- | 1 days | --- |
| visitor_id18452 | pardot.com | --- | 10 years | --- |
| visitor_id18452-hash | pardot.com | --- | 10 years | --- |
| lpv18452 | pi.pardot.com | --- | Session | --- |
| lhc_per | www.voxco.com | --- | 6 months | --- |
| _uetvid | www.voxco.com | --- | 1 year | --- |