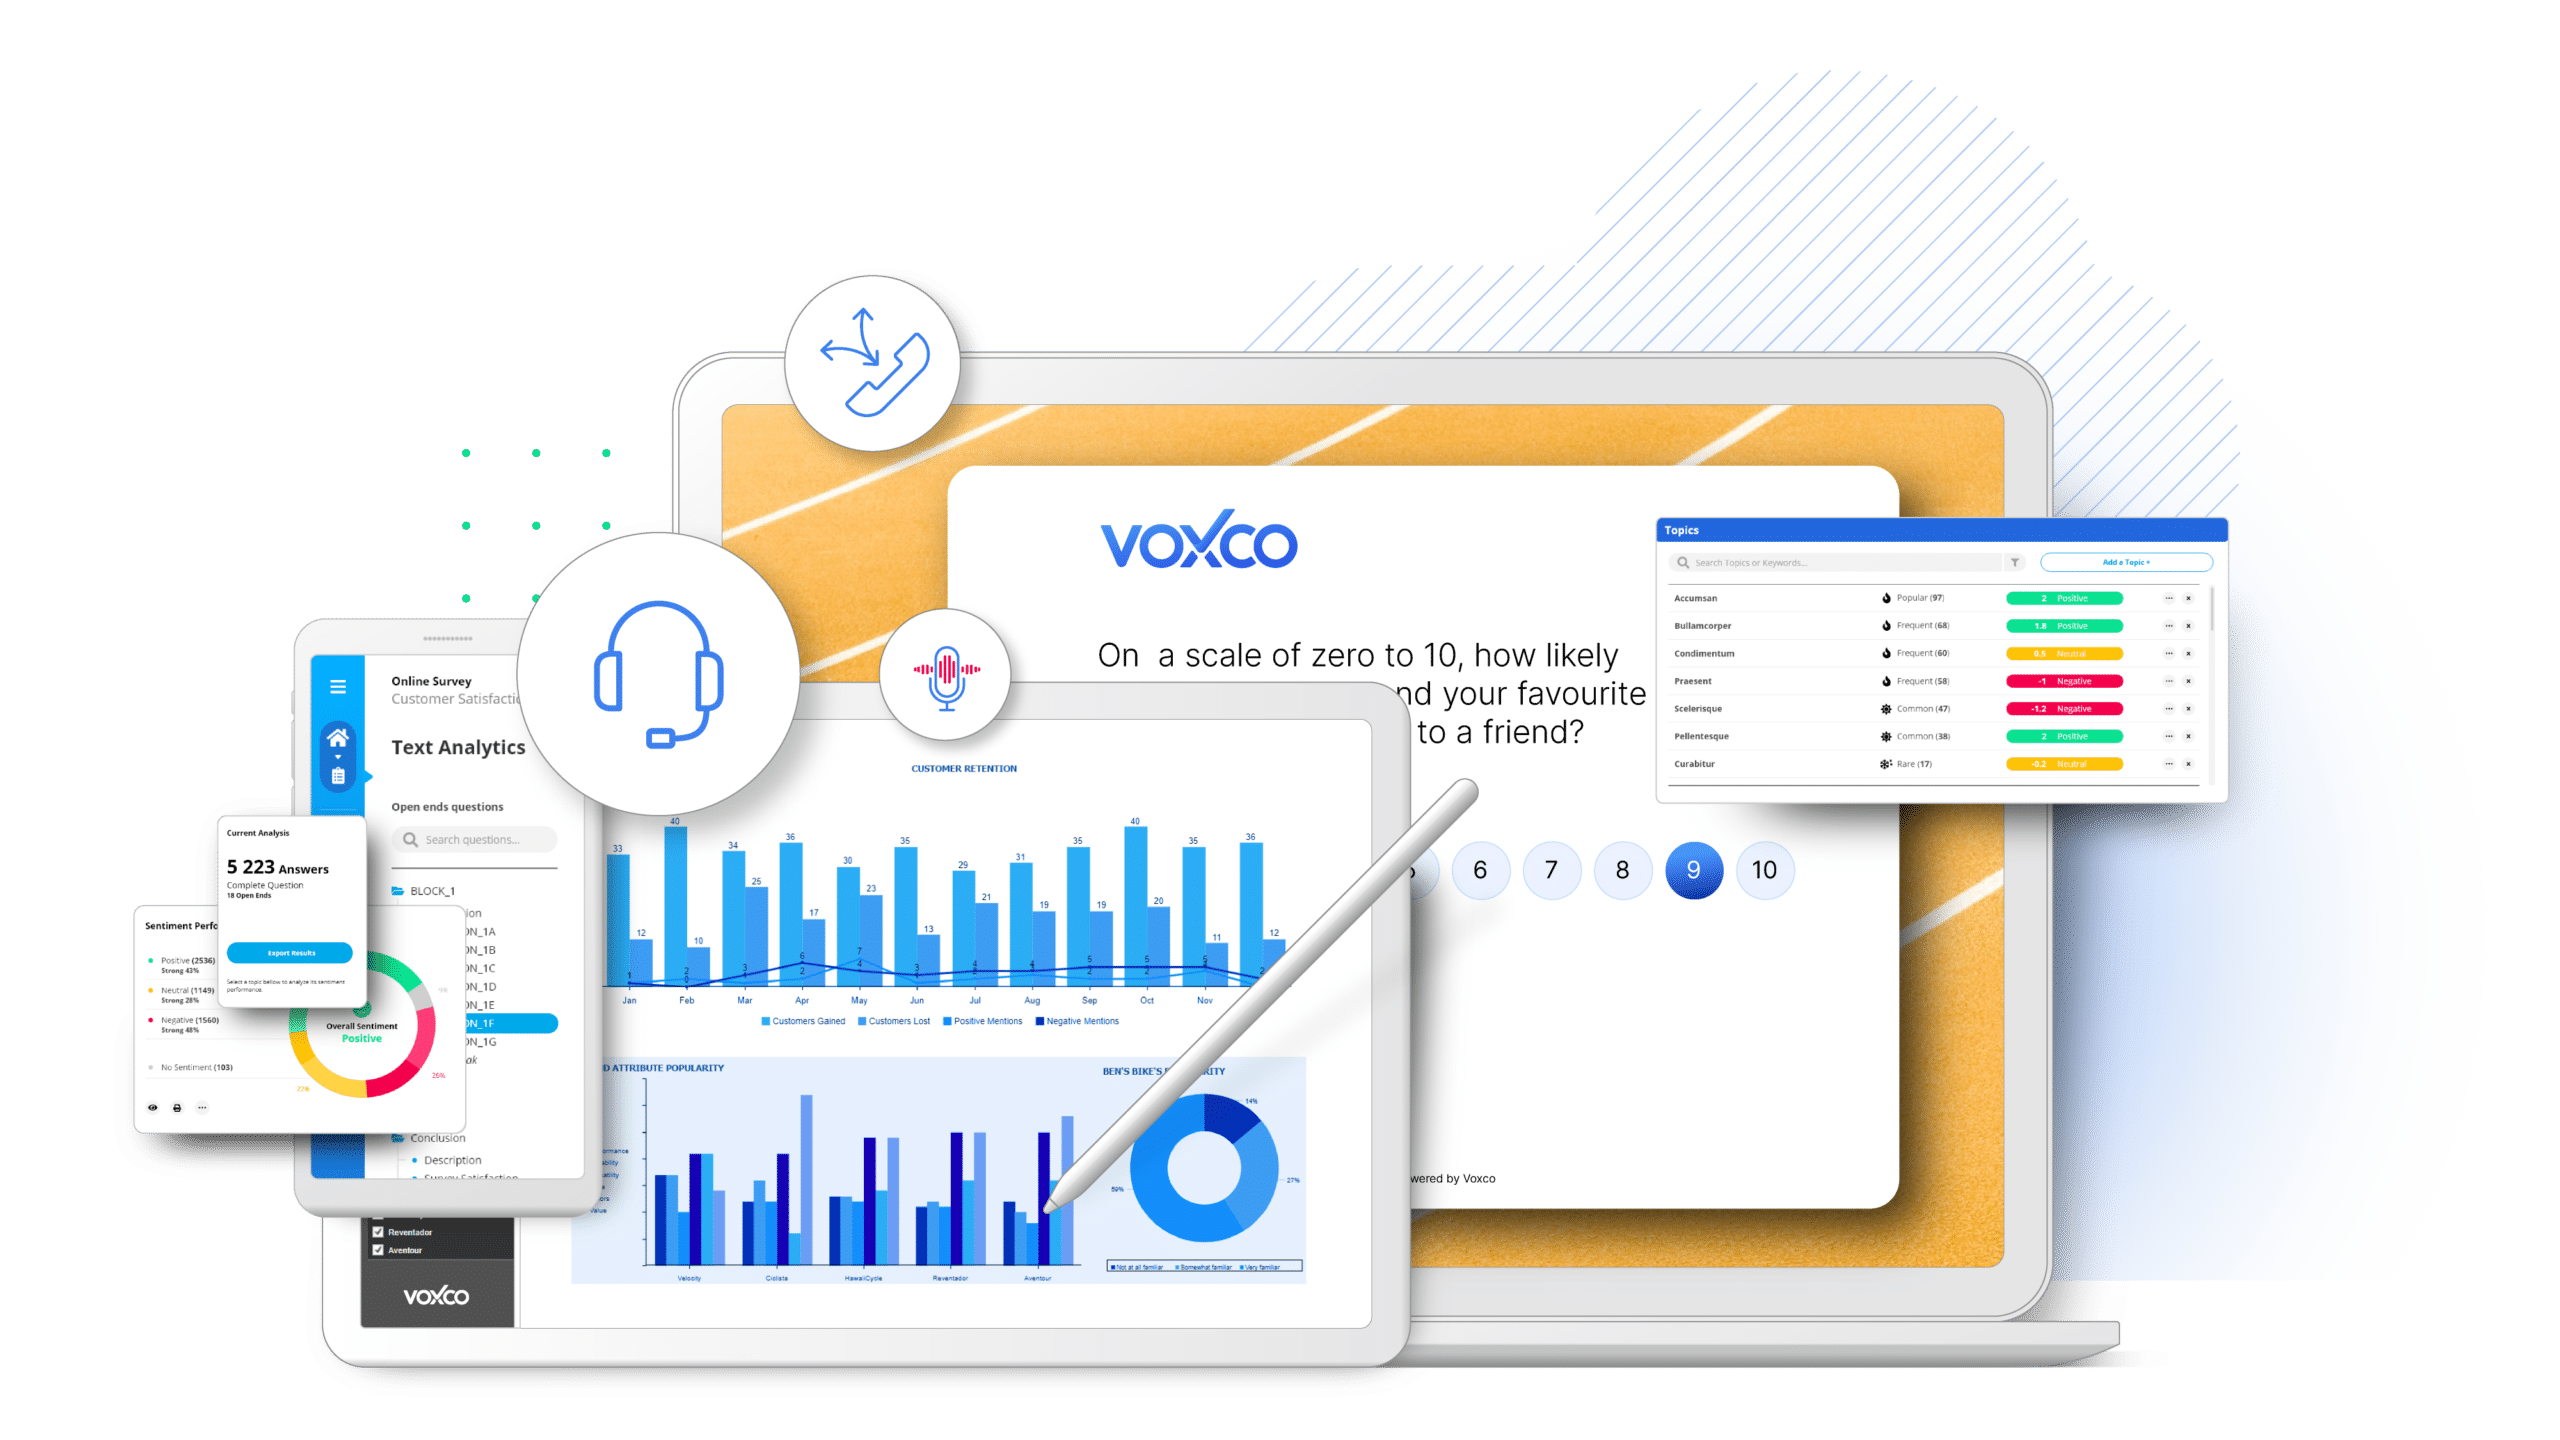
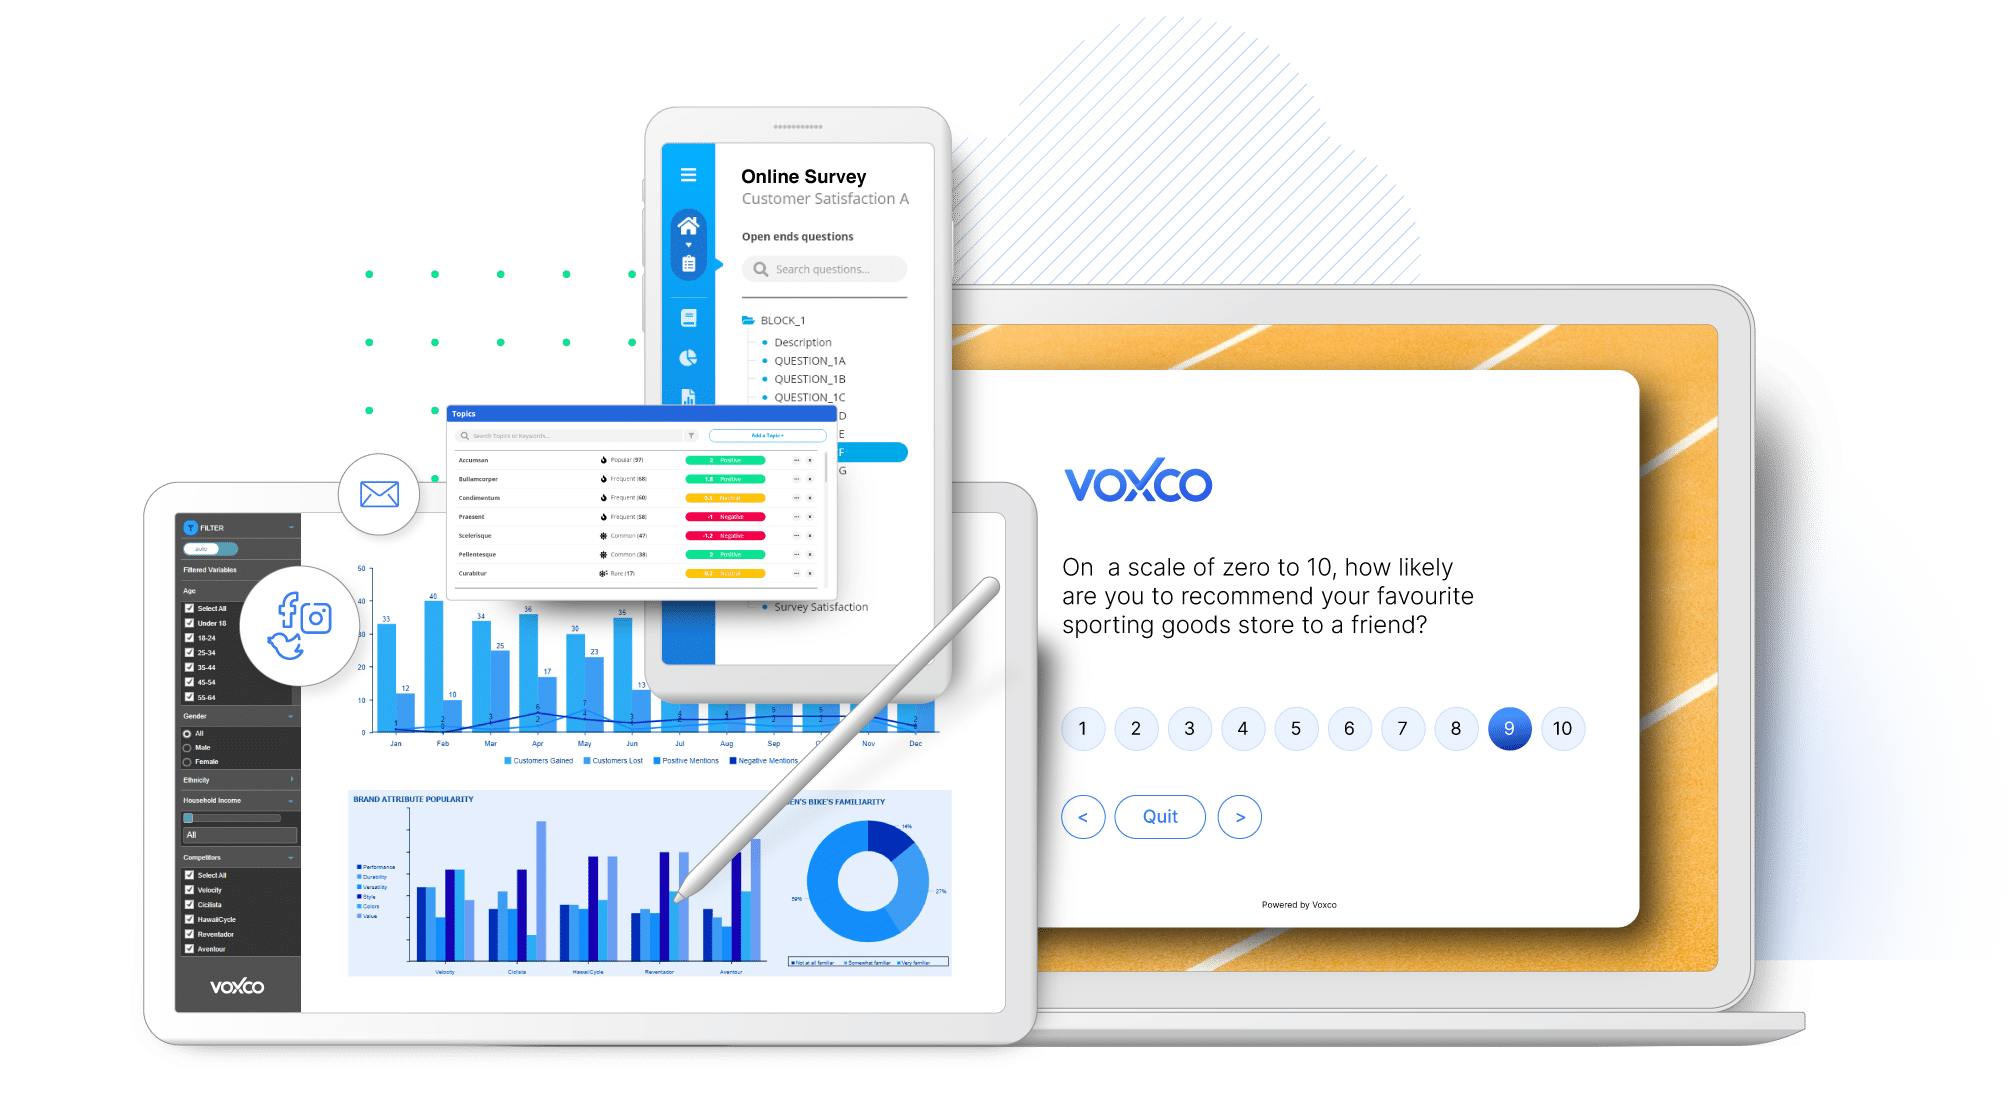
Noch nie war es so einfach, Ihre Umfragedaten in Erkenntnisse umzusetzen. Voxco Analytics bietet Ihnen alle Werkzeuge, die Sie benötigen, um Ihre Daten vorzubereiten, Kreuztabellen zu erstellen und aus Daten basierende visuelle Geschichten zu erzählen. Danach können Sie alles mit anderen teilen.
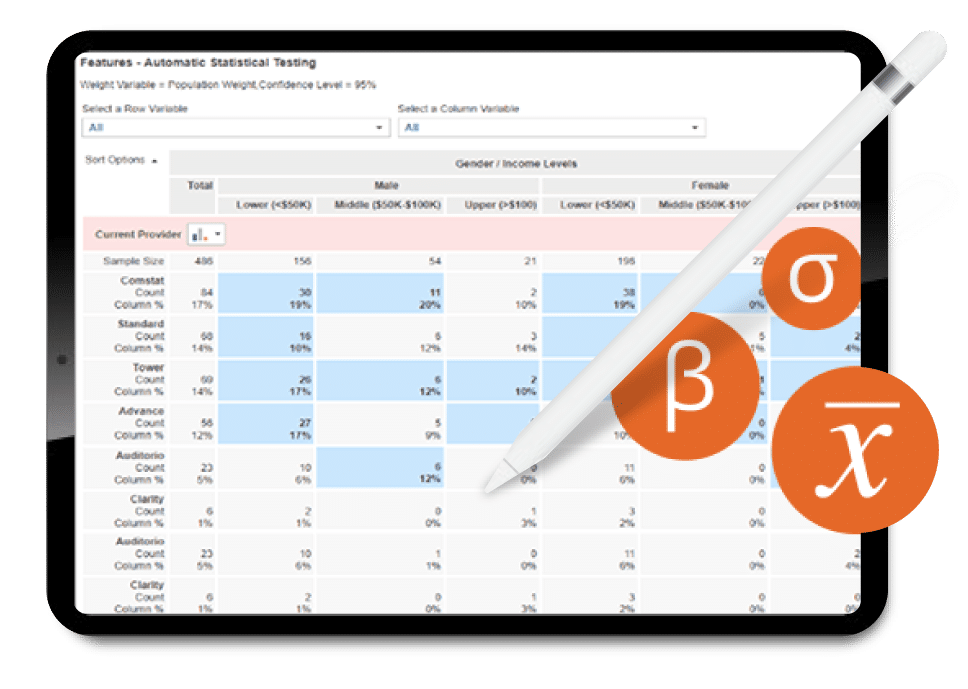
Mit unserer leistungsstarken Drag-and-Drop-Funktion können Sie schnell jede beliebige Kreuztabelle erstellen, auch sehr komplexe. Sie brauchen sich keine Sorgen um statistische Tests zu machen. Kreuztabellen beinhalten automatische Statistiktests, die Farbcodes auf Zellen anwenden, in denen statistische Signifikanz gefunden wird. Sie können auch eine erweiterte Statistikanalyse durchführen, Variablen verwalten, Gewichtungen anwenden und die Daten der Befragten in unserem System bereinigen.
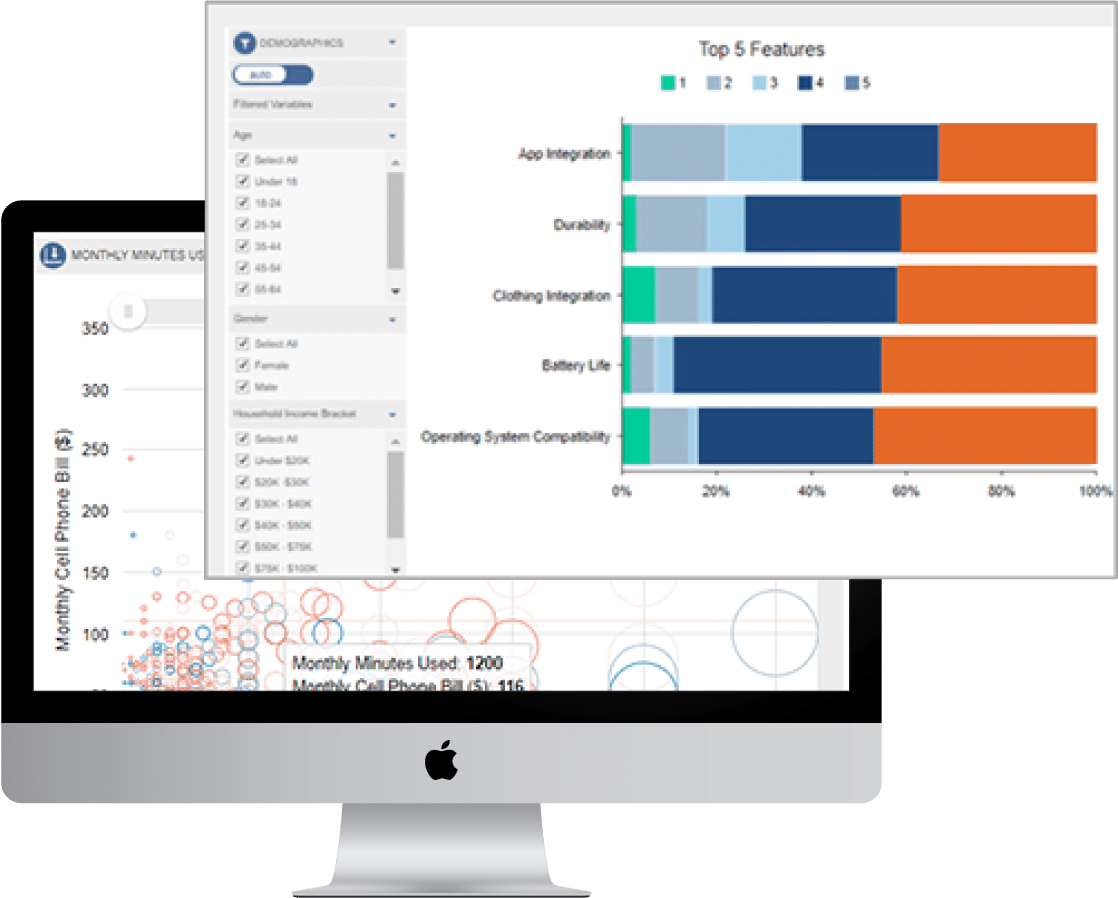
Kreuztabellen können mit einem einfachen Klick in visuelle Diagramme umgewandelt werden. Gewinnen Sie ein tieferes Verständnis Ihrer Umfrageergebnisse, indem Sie dynamische Filter auf Diagramme anwenden und die Daten aus verschiedenen Perspektiven visualisieren. Ihre Diagramme sind immer auf dem neuesten Stand, da neue Daten automatisch hinzugefügt werden. Wenn Sie zur Freigabe bereit sind, exportieren Sie einfach zusammen mit den zugrunde liegenden Daten in PowerPoint oder veröffentlichen Sie sie im Portal Schlüsselergebnisse.
Dashboards sind eine ansprechende Möglichkeit, um Datengeschichten effektiv zu vermitteln. Benutzer können Trends und Beziehungen zwischen Datenpunkten sofort erkennen. Dashboards eignen sich ideal für Tracking-Studien, syndizierte Forschungsprojekte oder hochkarätige Ad-hoc-Umfragen. Unsere Dashboards können Kreuztabellen, Diagramme, Bilder, Videos und Ihr eigenes Branding beinhalten. Sie aktualisieren sich dynamisch mit neuen Daten und Benutzer können Ansichten filtern.
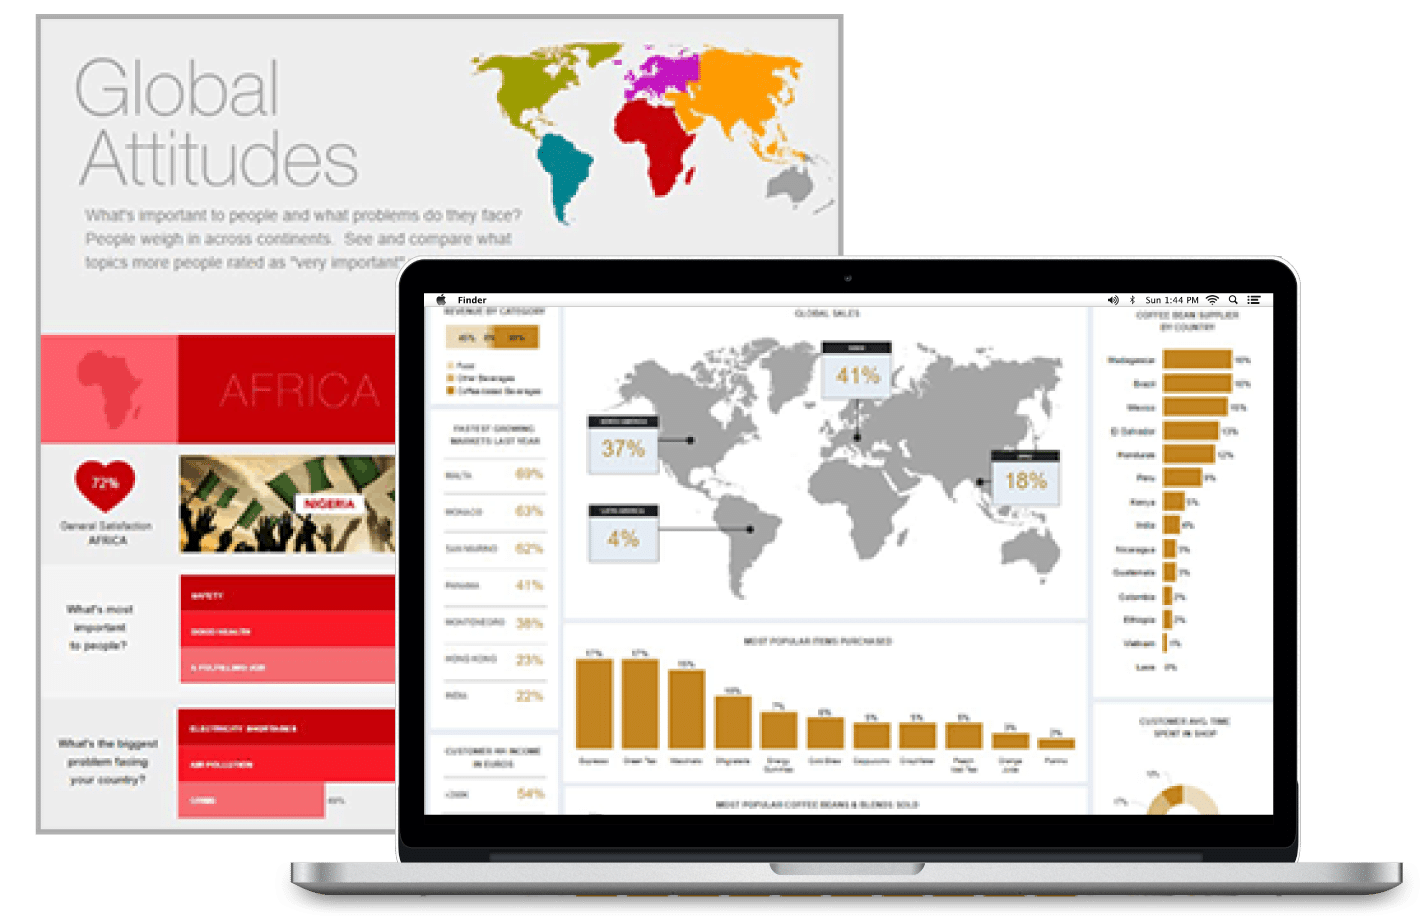

Unser System verfügt über ein Schlüsselergebnisse, mit dem Sie Ihre wichtigsten Ergebnisse sicher mit Kollegen und Kunden teilen können. In Schlüsselergebnisse können Ihre Benutzer mit ihren Kreuztabellen, Diagrammen, Dashboards interagieren und sogar ihre Ergebnisse exportieren. Sie können Ihre Ordner organisieren und verschiedene Berechtigungen vergeben – so haben Sie die volle Kontrolle darüber, was andere in ihrem Konto sehen und tun können. Zusammenarbeit leicht gemacht.
Need more details about pricing?
Fill out a short form & our team will contact you with the details.

The significance of any survey software lies in its ability to transform survey collected data into meaningful and presentable inputs that can feed decision making. The survey data must be summarized and analysed in such a manner that it becomes easy even for a layman to interpret.
A good survey analytics software must be capable of translating both quantitative and qualitative information into meaningful results . This is because quantitative data can be used to understand a particular issue or topic, but the insights required to fuel the company in the right direction is obtained by how well a software is able to generate inferences by providing precise takeaways .
Further these services must be customized for the end user and should be compatible in all types of presentation formats. This offers the convenience that any organization looks for in a good survey software.
The basis of choosing the right kind of survey software is based on how well the multiple tools of research offered by a particular software can be used to achieve research objectives.
Essentially, a survey analytics platform covers all aspects of survey research including designing , distribution, collection and result analysis. The core basis of judgement , however, is the result analytics part. It includes a comprehensive set of tools that can be used by the researching party to put the collected results in manner that meets their need with respect to how they wish utilize the data.
This is the basic planning phase of a survey research where the software allows the researching party to design a questionnaire that helps them collect accurate data through a careful choice of question types and logical functions.
This is the second phase where the survey so designed gets distributed to the target participants who are deemed fit to qualify as a respondent based on whether or not they the required criteria. Survey software allows for multiple distribution options such as restricted access, selection of channels through which distribution takes place , invitation based surveys and panel management distribution to a hand picked group of qualified respondents.
The process of collection entails the consolidation of data collected on a single platform for further usage in analysis. Most survey softwares set a limit to the number of required responses beyond which no more data is required.
Advanced softwares such as Voxco provide real time participation monitoring and scheduled reporting and collection of the results to study the minute details such as screen outs , completion time and other disposition snapshots which speak to the quality of respondents as well as allow registering of major turning points and variables by adjusting reports as and when the data keeps getting added.
This is the final part of research where the organization decides whether or not they have been successful in achieving their end objective. The data so collected gets presented in manner which allows the company to use it for the desired purpose. This calls for a careful choice of tools that convert the data in the preferred manner.
Analysis of data determines the quality of the entire research process. Even if the other functions are performed properly , analysis can make or break the research. The researcher has keep in mind the stakeholders and their peculiar needs while deciding to go for a particular methodology of analysis.
Any action or follow up taken on the basis of a survey research is based on how it has been projected. For example : companies launch products after conducting pre-tests to analyse market sentiment and acceptability towards a certain product or service. Based on the information collected , companies make decisions about modifications, marketing and promotional channels, pricing , packaging, offers , incentives ,after sales services and many other concepts only for the soul purpose of improving customer experience. Each and every strategy of the company gets fuelled by how well the company has done in terms of presenting what was collected without compromising on the quality and authenticity of the data .
Further , companies stake a lot in terms of reputation, resources, time and effort just to tick the right boxes by adapting themselves to meet the expectations of the audience they serve. If these changes gets channelled in the wrong direction due to faulty analysis , misrepresentation or omission of important information, the companies can suffer hugely.
So , the importance of conducting nuanced survey analytics cannot be undermined in terms of the impact it has on market performance of companies.
Survey analytics softwares such as Voxco provides all the tools and services an organization needs allowing companies to reduce their effort and conduct their research in the way they like with all the requirements at their disposal. An organization looking to conduct a study need not jump from one site to another in search of the right tools that fit their needs.
Every research is different and one size does not fit all . Software analytics platforms allow the companies to modify their surveys to suit their personality, look and feel and appeal to their target audience in a way they know. There is no streamlining in terms of templates, question types and analytics tools which makes it the ideal choice.
Survey softwares know the right channels and audiences who can help meet the required number of responses within specified time frames. Moreover , they help access qualified respondents who have the relevant knowledge and experience to become respondents for specific topics. Thus, samples become represent the view points of the targeted segment and so the their feedback is actionable.
Information gets collected directly from the respondents. There is no scrutiny or errors as there is no need to copy or rewrite and so the data is reliable.
We use cookies in our website to give you the best browsing experience and to tailor advertising. By continuing to use our website, you give us consent to the use of cookies. Weiterlesen
| Name | Domain | Zweck | Ablauf | Art |
|---|---|---|---|---|
| hubspotutk | www.voxco.com | HubSpot functional cookie. | 1 year | HTTP |
| lhc_dir_locale | amplifyreach.com | --- | 52 years | --- |
| lhc_dirclass | amplifyreach.com | --- | 52 years | --- |
| Name | Domain | Zweck | Ablauf | Art |
|---|---|---|---|---|
| _fbp | www.voxco.com | Facebook Pixel advertising first-party cookie | 3 months | HTTP |
| __hstc | www.voxco.com | Hubspot marketing platform cookie. | 1 year | HTTP |
| __hssrc | www.voxco.com | Hubspot marketing platform cookie. | 52 years | HTTP |
| __hssc | www.voxco.com | Hubspot marketing platform cookie. | Session | HTTP |
| Name | Domain | Zweck | Ablauf | Art |
|---|---|---|---|---|
| _gid | www.voxco.com | Google Universal Analytics short-time unique user tracking identifier. | 1 days | HTTP |
| MUID | bing.com | Microsoft User Identifier tracking cookie used by Bing Ads. | 1 year | HTTP |
| MR | bat.bing.com | Microsoft User Identifier tracking cookie used by Bing Ads. | 7 days | HTTP |
| IDE | doubleclick.net | Google advertising cookie used for user tracking and ad targeting purposes. | 2 years | HTTP |
| _vwo_uuid_v2 | www.voxco.com | Generic Visual Website Optimizer (VWO) user tracking cookie. | 1 year | HTTP |
| _vis_opt_s | www.voxco.com | Generic Visual Website Optimizer (VWO) user tracking cookie that detects if the user is new or returning to a particular campaign. | 3 months | HTTP |
| _vis_opt_test_cookie | www.voxco.com | A session (temporary) cookie used by Generic Visual Website Optimizer (VWO) to detect if the cookies are enabled on the browser of the user or not. | 52 years | HTTP |
| _ga | www.voxco.com | Google Universal Analytics long-time unique user tracking identifier. | 2 years | HTTP |
| _uetsid | www.voxco.com | Microsoft Bing Ads Universal Event Tracking (UET) tracking cookie. | 1 days | HTTP |
| vuid | vimeo.com | Vimeo tracking cookie | 2 years | HTTP |
| Name | Domain | Zweck | Ablauf | Art |
|---|---|---|---|---|
| __cf_bm | hubspot.com | Generic CloudFlare functional cookie. | Session | HTTP |
| Name | Domain | Zweck | Ablauf | Art |
|---|---|---|---|---|
| _gcl_au | www.voxco.com | --- | 3 months | --- |
| _gat_gtag_UA_3262734_1 | www.voxco.com | --- | Session | --- |
| _clck | www.voxco.com | --- | 1 year | --- |
| _ga_HNFQQ528PZ | www.voxco.com | --- | 2 years | --- |
| _clsk | www.voxco.com | --- | 1 days | --- |
| visitor_id18452 | pardot.com | --- | 10 years | --- |
| visitor_id18452-hash | pardot.com | --- | 10 years | --- |
| lpv18452 | pi.pardot.com | --- | Session | --- |
| lhc_per | www.voxco.com | --- | 6 months | --- |
| _uetvid | www.voxco.com | --- | 1 year | --- |