Role of Competitive Product Analysis in Product Experience
Role of Competitive Product Analysis in Product Experience SHARE THE ARTICLE ON Table of Contents A company can’t launch a product without determining if it’s

Find the best survey software for you!
(Along with a checklist to compare platforms)
Take a peek at our powerful survey features to design surveys that scale discoveries.
Explore Voxco
Need to map Voxco’s features & offerings? We can help!
Find the best customer experience platform
Uncover customer pain points, analyze feedback and run successful CX programs with the best CX platform for your team.

We’ve been avid users of the Voxco platform now for over 20 years. It gives us the flexibility to routinely enhance our survey toolkit and provides our clients with a more robust dataset and story to tell their clients.
Steve Male
VP Innovation & Strategic Partnerships, The Logit Group
Explore Regional Offices

Find the best survey software for you!
(Along with a checklist to compare platforms)
Take a peek at our powerful survey features to design surveys that scale discoveries.
Explore Voxco
Need to map Voxco’s features & offerings? We can help!
Find the best customer experience platform
Uncover customer pain points, analyze feedback and run successful CX programs with the best CX platform for your team.

We’ve been avid users of the Voxco platform now for over 20 years. It gives us the flexibility to routinely enhance our survey toolkit and provides our clients with a more robust dataset and story to tell their clients.
Steve Male
VP Innovation & Strategic Partnerships, The Logit Group
Explore Regional Offices

Find the best survey software for you!
(Along with a checklist to compare platforms)
Take a peek at our powerful survey features to design surveys that scale discoveries.
Explore Voxco
Need to map Voxco’s features & offerings? We can help!
Find the best customer experience platform
Uncover customer pain points, analyze feedback and run successful CX programs with the best CX platform for your team.

We’ve been avid users of the Voxco platform now for over 20 years. It gives us the flexibility to routinely enhance our survey toolkit and provides our clients with a more robust dataset and story to tell their clients.
Steve Male
VP Innovation & Strategic Partnerships, The Logit Group
Explore Regional Offices
SHARE THE ARTICLE ON

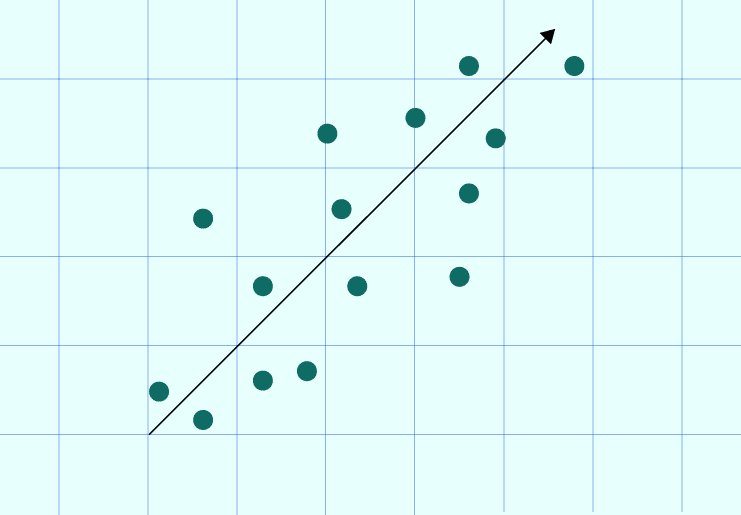
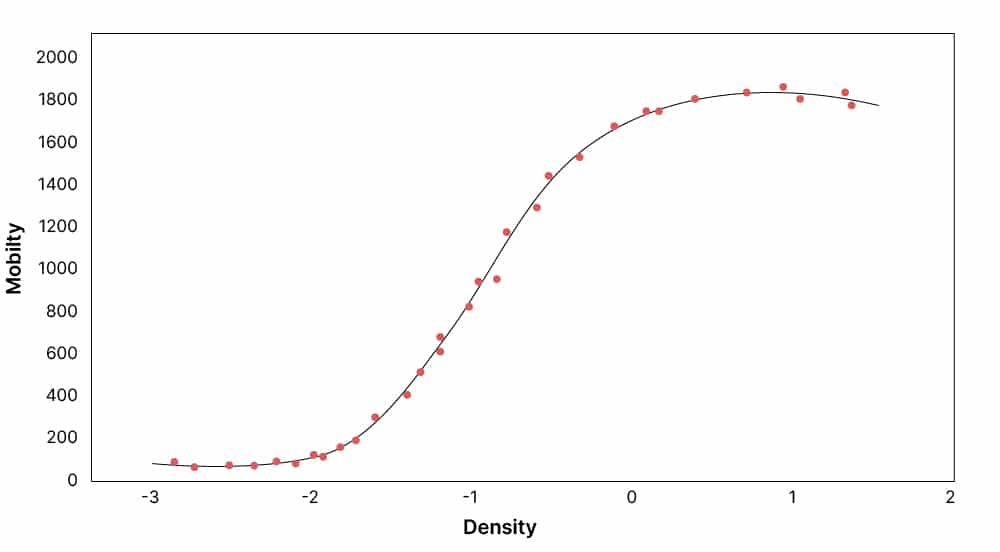
Linear regression is used when the independent and dependent variables have a linear relationship with each other. Meaning, when one variable increases, the other increases too. This gives a straight line on the graph as a line of best fit. But when it comes to nonlinear regression, as the name suggests, the relationship between the independent and the dependent variable is not linear. Meaning, when one variable increases, the other variable may increase or decrease. This gives us a curve as the line of best fit on a graph.

Hence, the nonlinear regression is a curved function of the X variable (independent variable) that is used to predict the Y variable (dependent variable).
Conducting exploratory research seems tricky but an effective guide can help.
A simple nonlinear regression model is stated as follows:

Where,
Y is vector of predictors P
β is a vector of parameters k
f is the regression function
ϵ is error
Nonlinear regression model can also be written as:

Where,
Yi is a response variable
x is input
h is function
Ѳ is the estimated parameter
The model is focused on reducing the sum of squares as minimum as possible using the iterative numeric procedure. The least-square method is the best fit for the same which tells us how many observations are different from the dataset mean.
See Voxco survey software in action with a Free demo.
An example of nonlinear regression can be studying the share price of a certain company. Any booking app uses graphs to state the development of the company’s stock market performance. You can see no graph have a straight line upwards or downwards. You will get to see a nonlinear relationship between prices and time. A regime-switch model can be used to see the past performance of the share and how it can grow in the future.
The important thing to observe here is that both the independent and dependent variables are quantitative. Meaning, they are measured in numbers. All the qualitative or categorical data should be measured in binary or other quantitative variables.

See why 450+ clients trust Voxco!
By providing this information, you agree that we may process your personal data in accordance with our Privacy Policy.
Read more
Role of Competitive Product Analysis in Product Experience SHARE THE ARTICLE ON Table of Contents A company can’t launch a product without determining if it’s

How to Choose the Right Market Research Survey Software for Your Business? SHARE THE ARTICLE ON Table of Contents Kickstart your market research with a

How Uber Mastered Customer Experience Read Uber’s secret to customer experience Get our in-depth guide to understand how Uber maintains such a loyal customer base

10 Best Practices for Conducting Market Research with Survey Software SHARE THE ARTICLE ON Table of Contents If you’re a brand that sells a product

Conducting research studies can be intense! Surveys, analytics, data verification, and monitoring. One of the most rewarding parts of research is when you get to showcase your survey results to your stakeholders.

What is Demographic Segmentation? Voxco makes your market research fast & easy! Watch a demo Demographic segmentation is a market segmentation technique where an organization’s
We use cookies in our website to give you the best browsing experience and to tailor advertising. By continuing to use our website, you give us consent to the use of cookies. Read More
| Name | Domain | Purpose | Expiry | Type |
|---|---|---|---|---|
| hubspotutk | www.voxco.com | HubSpot functional cookie. | 1 year | HTTP |
| lhc_dir_locale | amplifyreach.com | --- | 52 years | --- |
| lhc_dirclass | amplifyreach.com | --- | 52 years | --- |
| Name | Domain | Purpose | Expiry | Type |
|---|---|---|---|---|
| _fbp | www.voxco.com | Facebook Pixel advertising first-party cookie | 3 months | HTTP |
| __hstc | www.voxco.com | Hubspot marketing platform cookie. | 1 year | HTTP |
| __hssrc | www.voxco.com | Hubspot marketing platform cookie. | 52 years | HTTP |
| __hssc | www.voxco.com | Hubspot marketing platform cookie. | Session | HTTP |
| Name | Domain | Purpose | Expiry | Type |
|---|---|---|---|---|
| _gid | www.voxco.com | Google Universal Analytics short-time unique user tracking identifier. | 1 days | HTTP |
| MUID | bing.com | Microsoft User Identifier tracking cookie used by Bing Ads. | 1 year | HTTP |
| MR | bat.bing.com | Microsoft User Identifier tracking cookie used by Bing Ads. | 7 days | HTTP |
| IDE | doubleclick.net | Google advertising cookie used for user tracking and ad targeting purposes. | 2 years | HTTP |
| _vwo_uuid_v2 | www.voxco.com | Generic Visual Website Optimizer (VWO) user tracking cookie. | 1 year | HTTP |
| _vis_opt_s | www.voxco.com | Generic Visual Website Optimizer (VWO) user tracking cookie that detects if the user is new or returning to a particular campaign. | 3 months | HTTP |
| _vis_opt_test_cookie | www.voxco.com | A session (temporary) cookie used by Generic Visual Website Optimizer (VWO) to detect if the cookies are enabled on the browser of the user or not. | 52 years | HTTP |
| _ga | www.voxco.com | Google Universal Analytics long-time unique user tracking identifier. | 2 years | HTTP |
| _uetsid | www.voxco.com | Microsoft Bing Ads Universal Event Tracking (UET) tracking cookie. | 1 days | HTTP |
| vuid | vimeo.com | Vimeo tracking cookie | 2 years | HTTP |
| Name | Domain | Purpose | Expiry | Type |
|---|---|---|---|---|
| __cf_bm | hubspot.com | Generic CloudFlare functional cookie. | Session | HTTP |
| Name | Domain | Purpose | Expiry | Type |
|---|---|---|---|---|
| _gcl_au | www.voxco.com | --- | 3 months | --- |
| _gat_gtag_UA_3262734_1 | www.voxco.com | --- | Session | --- |
| _clck | www.voxco.com | --- | 1 year | --- |
| _ga_HNFQQ528PZ | www.voxco.com | --- | 2 years | --- |
| _clsk | www.voxco.com | --- | 1 days | --- |
| visitor_id18452 | pardot.com | --- | 10 years | --- |
| visitor_id18452-hash | pardot.com | --- | 10 years | --- |
| lpv18452 | pi.pardot.com | --- | Session | --- |
| lhc_per | www.voxco.com | --- | 6 months | --- |
| _uetvid | www.voxco.com | --- | 1 year | --- |