The Dependent Samples t-test: A Synthesis of Theory, Application, and Results

SHARE THE ARTICLE ON

Concept Testing2 2
Table of Contents

What is dependent samples t-test?

Dependent samples t-test is conducted when the observations of one sample group is known to be related in some way to the other observations of sample group. So typically, dependent sample t-test compares the means of those two related sample groups. 

This type of statistical t-test method is mostly used when you know you are studying similar specimen or relatable units or even when there are repeated measurements taken for on sample group. 

Some of the other names of dependent sample t-test are:

  • Dependent Samples t-test
  • Matched-Pairs t-test
  • Repeated Measures t-test
  • t-test for Dependent Means
  • t-test for Related Samples

Exploratory Research Guide

Conducting exploratory research seems tricky but an effective guide can help.

Conducting a dependent samples t-test

Dependent samples t-test is also called paired t-test because, the measurements of one group is paired with the measurements of the other group. Hence, repeated observation or paired observations becomes an important part of the study. Example: a patient’s health condition before the treatment and after the treatment. The unit of measure and the subject might be the same but there is a difference in time logs. 

Dependent variable groups the measureable variables like age, height, weight, temperature from different groups and then put them against each other to compare the progress. This technique to pairing the data samples and conducting dependent samples t-test have been proven to be an effective way of drawing out the cause-effect relationship between the sample groups. The difference is, dependent samples t-test just shows the difference in the means and how the variables have progressed, and not the direction in which the causality has occurred and how one variable is affecting the other. 

Before deciding to conduct dependent samples t-test on the data, ask yourself these questions to make sure you are in the right direction:

  • Does each pair of observations have a direct relationship between them?
  • Are the observations totally random?
  • Is it necessary for both the samples to have equal number of data points?

If all the answers to the above questions turn out to be “Yes”, then the dependent samples t-test is the best fit for your data. Or else, you can use independent samples t-test.

Example of dependent samples t-test

A teacher, after seeing the poor mathematics scores of the class, decides to conduct special tutoring for the subject. The test was out of 10. She then compares the before and after scores of the students and the results come out as follows:

Before

After 

7

9

6

10

5

7

4

5

4

7

6

5

7

9

5

6

5

8

7

7

The alpha is to be assumed as 0.05

The aim is to find whether the special tutoring was effective or not. 

Step 1: Define the null and alternative hypothesis

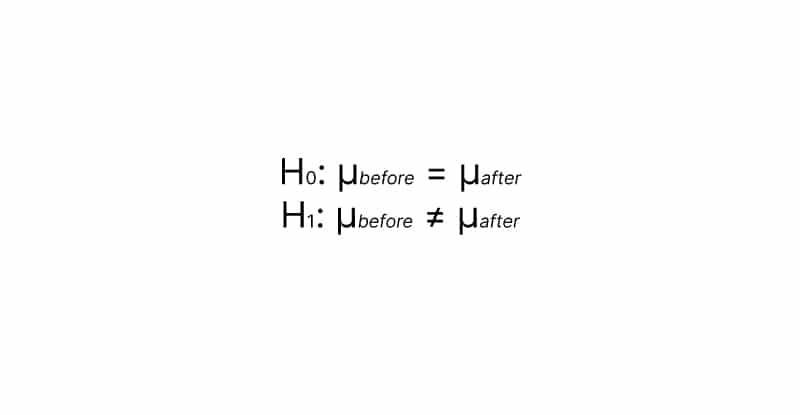
The hypothesis can be written as:

Dependent samples t-test dependent samples t-test

H0 means the null hypothesis: the mean before and mean after the special tutoring is equal. Meaning the course did not make any difference. 

H1 means the alternative hypothesis: the mean before and after the course is different. Meaning the course did make some difference.

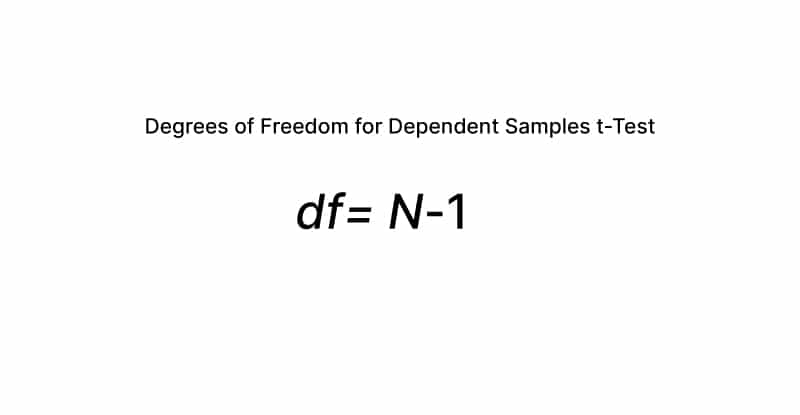
Step 2: Degrees of freedom

Dependent samples t-test dependent samples t-test

Degrees of freedom is the total number of observations, minus one. So in our case:

dF = 10-1

dF = 9

Step 3: State the decision rule

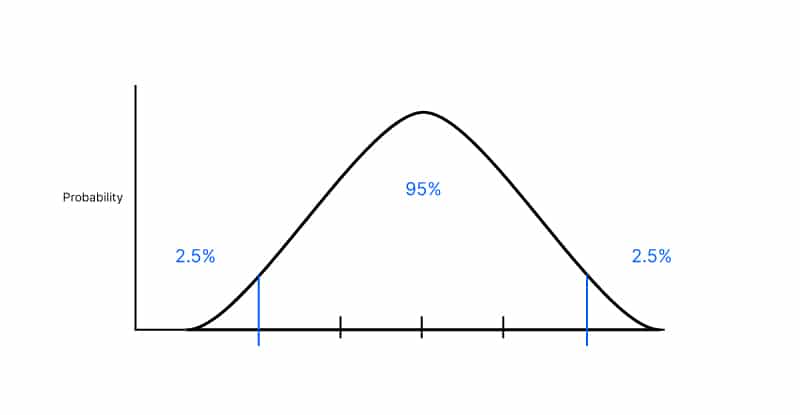
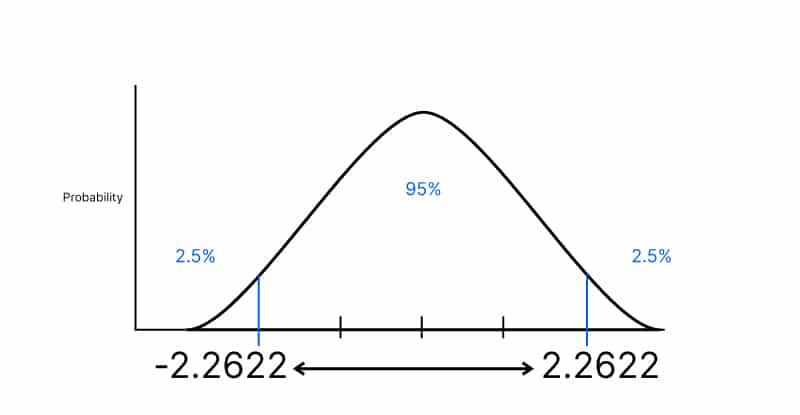
Now that we have an alpha of 0.05, we need to find the 5% of values that are rare and find out the T score associated with the two red lines in the graph below.

Dependent samples t-test dependent samples t-test

If the t score is below or above the 5%, it would be in our rejection region and we can conclude that sample has a different before and after. 

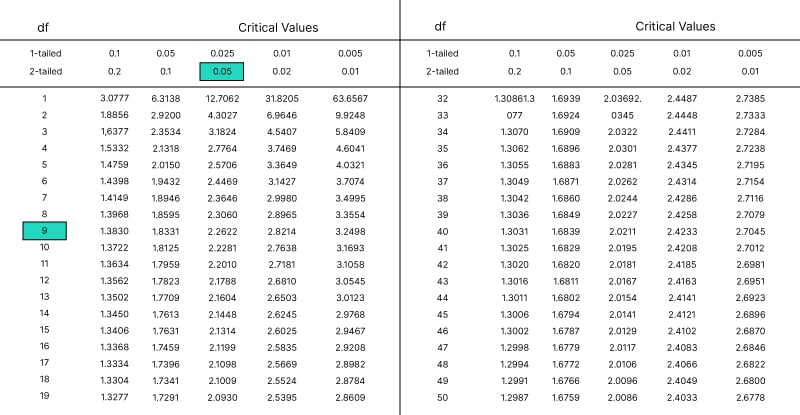
Looking at the below t-table, we can have a critical value of 2.2622

Dependent samples t-test dependent samples t-test

So we can expect the T value to fall between -2.2622 and 2.2622.

Dependent samples t-test dependent samples t-test

If t value goes outside of that, we will reject the null hypothesis. 

Hence our decision rule is: if t is less than -2.2622 or greater than 2.2622, reject the null hypothesis.

See Voxco survey software in action with a Free demo.

See Voxco survey software in action with a Free demo.

Step 4: Calculate the test statistics

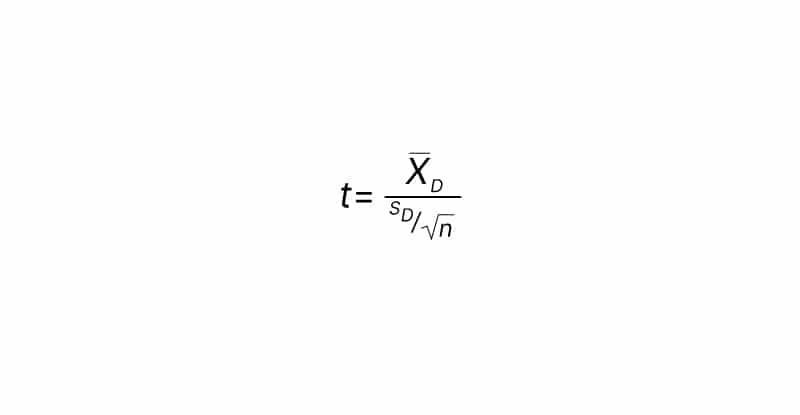
The formula for calculating the t is:

Dependent samples t-test dependent samples t-test

Where, 

X bar D is the mean difference

SD is the standard deviation divided by the root of sample size. 

For the difference, we will add one more column in the table as so:

Before

After 

Difference (After – Before)

7

9

2

6

10

4

5

7

2

4

5

1

4

7

3

6

5

-1

7

9

2

5

6

1

5

8

3

7

7

0

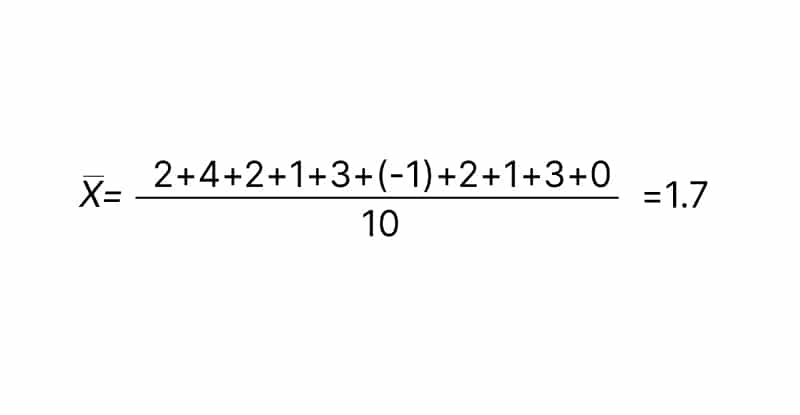
Now for the numerator, find the mean of the differences,

Dependent samples t-test dependent samples t-test

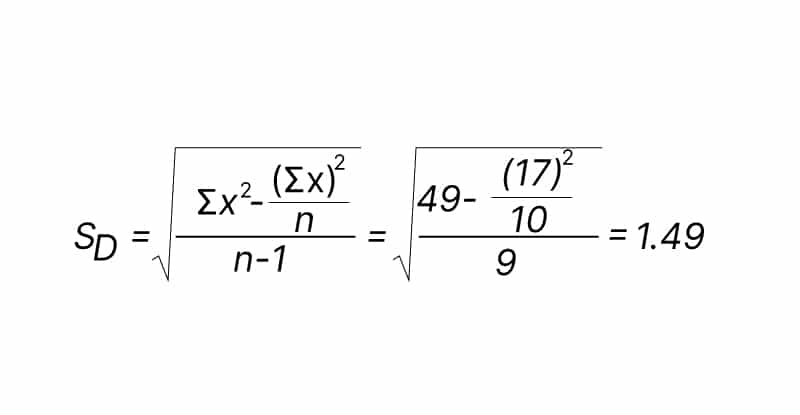
Noe for the standard deviation, we have the formula and it can be calculated as follows:

Dependent samples t-test dependent samples t-test

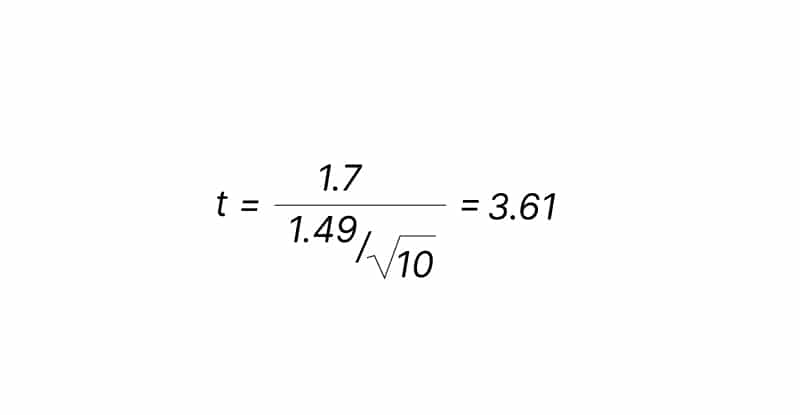
Now we calculate out t:

Dependent samples t-test dependent samples t-test

Step 5: State the result

According to our decision rule: if t is less than -2.2622 or greater than 2.2622, reject the null hypothesis. Our t is greater than +2.2622. 

Hence we reject the null hypothesis: the mean before and mean after the special tutoring is equal. Meaning the course did not make any difference.

Step 6: Conclusion

We can state that the special tutoring helped the students score more than before the tutoring.

Online survey tools 10 1

See why 450+ clients trust Voxco!

[fluentform id="10"]

By providing this information, you agree that we may process your personal data in accordance with our Privacy Policy.

Read more