Voxco logo white

All you need to know about cross-tabulation

Market research 04 12
See what question types are possible with a sample survey!
Table of Contents

01

What is cross-tabulation?

Cross-tabulation (also known as crosstab or contingency table) is a popular method used for quantitatively analyzing the relationship between two or more variables. Being one of the highly used analytical tools, it includes a multidimensional table for analyzing the number of respondents having specific characteristics highlighted in the table cells. By providing insightful information about the variables in the table, cross-tabulation is considered to be a mainstay of market research. Cross-tabulation plays a pivotal role in analyzing categorical data. For instance, the nutrition chart displayed at the back of a snack pack. The table provides extensive information about the ingredients that a particular snack has and how it adds to your energy levels. This analysis plays a crucial role in your diet and calorie intake. That’s how cross-tabulation works. Being a mainframe statistical model, it empowers you to make informed decisions by seamlessly identifying trends, patterns, and the correlation between different variables. The raw data gathered through a market research study can be frustrating. By using a cross-tab, you can effectively draw comparisons, identify trends, and discover correlations among the mutually inclusive factors.

All you need to know about cross-tabulation Cross tabulation

See what our clients say about Voxco

See what question types are possible with a sample survey!

02

Uncovering cross-tabulation with the help of an example

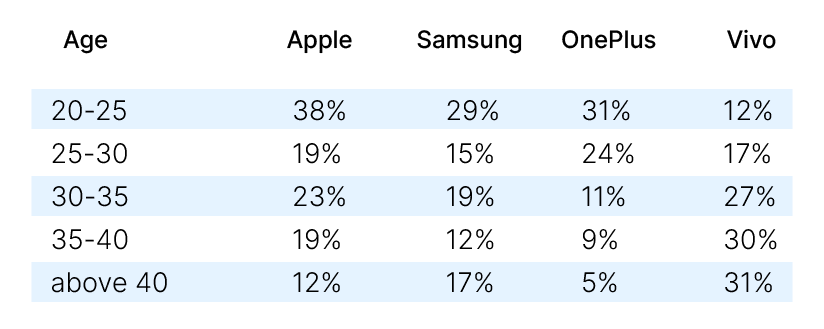
Cross-tab plays a critical role in statistical data analysis. Being specially designed to report or analyze data, it works well with both nominal and ordinal data. For instance, in the table given below, you can easily analyze the relationship between variables such as age and purchase of mobile phones.

The respondents have been asked two questions here:

What is your age?

Which mobile phone are you likely to purchase in the coming months?

From the above table, you can easily check the correlation between respondents’ age and their choice of a mobile phone brand. This way, crosstabs make it easy to delve deeper into data and identify the key trends and opportunities. Plus, you don’t get overwhelmed with the raw data collected through multiple responses.  

All you need to know about cross-tabulation Cross tabulation

Survey organizations around the world have maximized their phone survey ROI with the advanced features, hosting options, seamless telephony integration, and flexible pricing of our CATI software.

03

Cross-tabulation and Chi-Square Analysis

The Chi-square test is a statistical hypothesis used by researchers for determining if there’s a difference between observed frequency and expected frequency in the categories.

While cross-tabulating the findings of your study, it’s important to check if the cross-tab representation is right or wrong. In order to avoid such a quandary, chi-square analysis is computed with cross-tabulation. This plays a key role in identifying whether the variables included in your study are independent or dependent on each other. If the two variables are independent, it is known as insignificant tabulation and the study will be considered a null hypothesis. The outcome of this study will be unreliable due to no relationship between the factors. On the other hand, if there exists a relation between two variables, the tabulation results would be significant in that case and can be used for making well-informed strategic decisions.

The chi-square statistic can be easily computed for any crosstab. If the variables included in the table are related (suppose the relationship occurs at a low probability, like 4%) then we can conclude the results to be “statistically significant” at the .04 or 4% level.

This indicates that variables don’t have a great chance of being independent. The probability values (.04 or .01) highlight the researcher’s readiness for accepting a type I error or the chances of dismissing a null hypothesis (i.e. when we considered a relationship between variables while there wasn’t any).

Moreover, these probabilities are considered to be cumulative, i.e. if the number of tables being tested is 20, the researcher needs to be assured that at least one table having a relationship would be incorrect. So, the researchers should declare significance by applying criteria depending on the costs of mistakes.

[Free Webinar Recording]

Want to know how to increase your survey response rates?

Learn how to meet respondents where they are, drive survey completion while offering a seamless experience, Every Time!

The Voxco Guide to Market Research 08 12

04

Computing Chi-Square for your Cross-tabulation tables

In order to compute the chi-square statistic, you need to first compute the chi-square value for every cell of the table. Once you’ve successfully computed the chi-square value for each cell, you can club them together to get the total chi-square value for your table. You can use the following formula to compute the chi-square value for the cells of your table.  

Chi-square value: (Observed Value – Expected Value)2 / (Expected Value)

All you need to know about cross-tabulation Cross tabulation

Switch to Voxco Telephony System to improve your Call Center Productivity by 400% or more 

Survey organizations around the world have maximized their phone survey ROI with the advanced features, hosting options, seamless telephony integration, and flexible pricing of our CATI software.

The Voxco Guide to Market Research 09 12

05

What are the benefits of using cross-tabulation?

It eliminates the chances of confusion 

It can be challenging to interpret raw data. Irrespective of the size of your data sets, you’re likely to derive wrong results only by merely looking at that data. Cross tabulation empowers you with an easy way of grouping variables, which eliminates the chances of errors or confusion by yielding clear results. 

It helps to gain valuable insights

Cross tabulation plays a pivotal role in deriving actionable insights from raw data. Unless the raw data gets formatted as a table, these intelligent insights are not usually evident. By mapping out the relationship between different variables of a category, cross-tabulation helps researchers to gather deeper insights — that would have been overlooked otherwise!

It doesn’t require statistical analysis

By simplifying the process of interpreting data, cross-tabulation proves to be helpful for researchers having limited or no expertise in statistical analysis. By leveraging cross-tabulation, researchers can effortlessly correlate categorical variables without any statistical programming. This empowers them to seamlessly evaluate their current work and direct their future strategies accordingly. 

06

How Voxco can help you with cross-tabulation?

Best-in-class Analytics

Creating cross-tabulations and building visual data stories has never been so easy! Voxco’s powerful analytics software can help you uncover actionable insights from your data. 

Drag-and-drop Functionalities 

Voxco comes equipped with exceptional drag-and-drop functionalities that allow you to create any crosstab quickly. You can color-code your cells while seamlessly running advanced stats analysis and managing variables in our system.

Dynamic Dashboards

Voxco lets you convey data stories with dynamic dashboards that seamlessly identify trends and relationships between data points. Apart from crosstabs, our robust dashboards offer charts, images, and videos according to your branding. 

Premium Support 

Voxco’s robust platform is known for delivering round-the-clock support and guidance so you can make the most of your cross-tabulation data.

Read more